
Indicators of Ecosystem Health
Learn about the current State of Our Estuary through the status and trends of key indicators.

Indicators at a glance
What are the Indicators?
These indicators help us answer the question, “How is the Estuary doing?” by tracking our progress toward the goals of the Estuary Blueprint—the regional roadmap for restoring Estuary health. We assess both status (the current condition) and trend (whether things are improving, declining, or staying the same over time).
Explore our array of Estuary indicators here and learn more about our progress in supporting Clean Water, Quality Habitat, Resilient Processes, Flourishing Wildlife, and Thriving Communities.
Drone photography of Corte Madera Marsh. Pete Kauhanen, SFEI.
Indicators at a glance
What are the Indicators?
Our indicators track progress in the physical, ecological, and human dimensions of the Estuary’s health. An indicator is a measurable feature—like bird populations, water quality, or wetland acreage—that reflects the condition of a specific part of the ecosystem.
These indicators help us answer the question, “How is the Estuary doing?” by tracking our progress toward the goals of the Estuary Blueprint—the regional roadmap for restoring Estuary health. We assess both status (the current condition) and trend (whether things are improving, declining, or staying the same over time).
Explore our array of Estuary indicators here and learn more about our progress in supporting Clean Water, Quality Habitat, Resilient Processes, Flourishing Wildlife, and Thriving Communities.
Signs
of ecosystem health
Related indicators
Related indicators
Related indicators
How is the estuary doing?
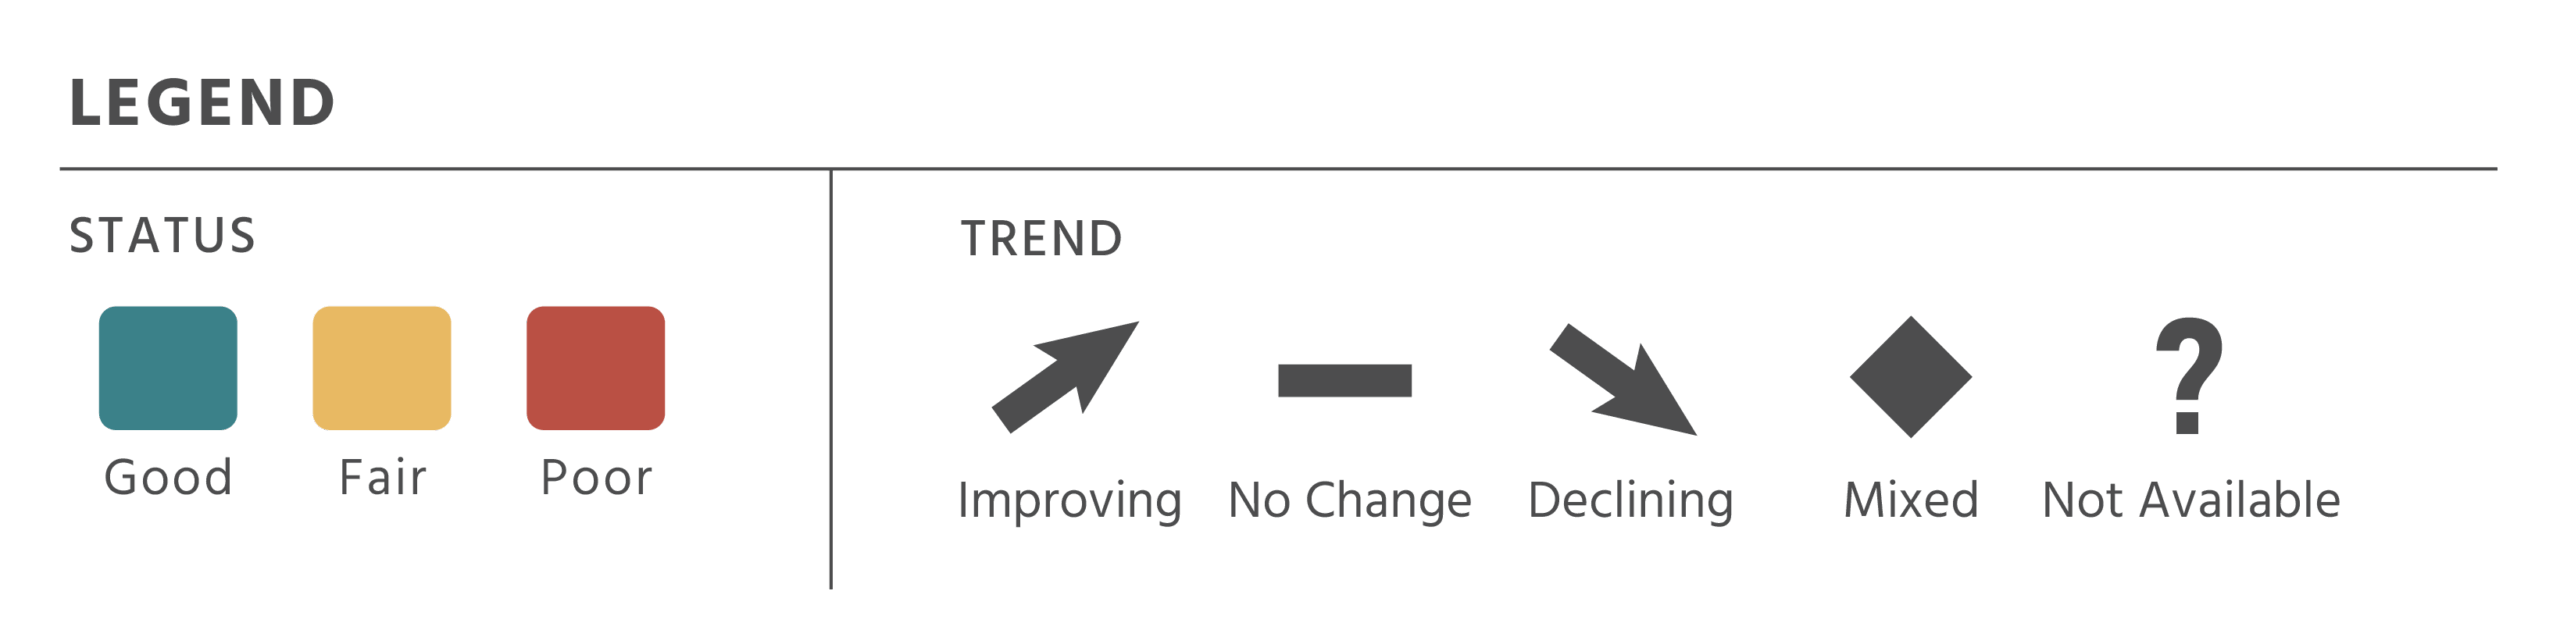
Status & Trend Scorecard
The State of Our Estuary scorecard gives an overview of all the indicators with a status and trend. It includes both the 2025 updates and findings carried forward from earlier reports. Each indicator is defined, with available status and trend scores, and includes a highlight from the most recent update. The date of the latest update appears in the scorecard’s final column.
Indicators not yet included in the scorecard are still in development, but are described briefly on their individual indicator pages. Among those, two—Sediment and Harmful Algal Blooms—have partial updates offering additional details as the indicators are being developed.
Learn more in the Common Questions section below and then enjoy venturing deeper into individual indicators via the category landing pages (Clean Water, Quality Habitat, Resilient Processes, Flourishing Wildlife, and Thriving Communities) and individual indicator pages listed in the menu bar at the top of this page.
| Indicator | Definition | Geography | Status & Trend | Indicator Highlight | Last Update |
|---|
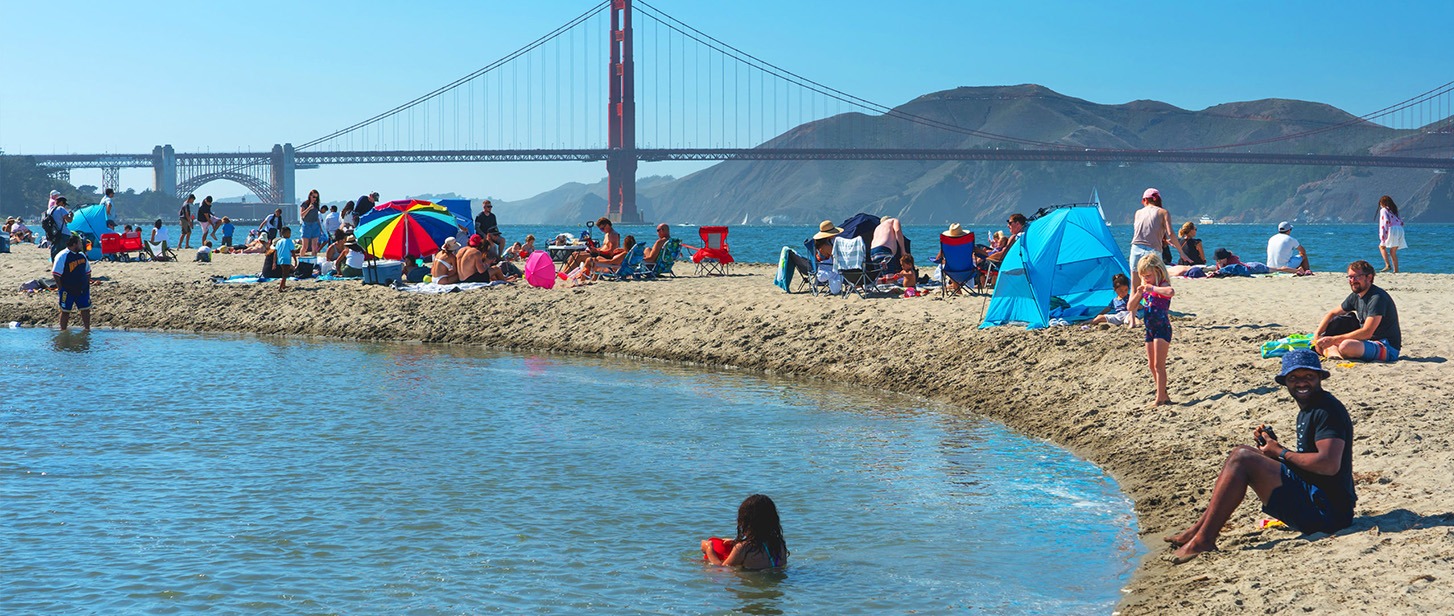
People relax on the beach near Chrissy Field in San Francisco. Shira Bezalel, SFEI.
Common Questions
Where do I look to find specific data about each indicator?
Each indicator has its own dedicated page that summarizes the latest findings on its status and trend, as analyzed and interpreted by the contributing scientists for that topic. To explore these, use the “Indicators” dropdown menu at the top of the page to browse the full list.
Each indicator page also provides helpful context—explaining why the indicator matters, what the findings mean, and how they relate to the health of the Estuary—in language that’s accessible to a wide audience.
An accordion feature at the bottom of each indicator page provides brief technical detail on the data used, the analysis approach, how benchmarks for scoring were determined, and a pop-up feature for full citations.
For those interested in a deeper dive, each page includes a link to the Technical Appendix, a downloadable document that details everything summarized on the indicator page, but in more technical detail.
Please note that not all indicators currently include status and trend information. Some are still in development, with studies underway or planned in the near future. In these cases, data are not yet available, but we’ll update the site as findings emerge.
How do I know when an indicator was last updated?
The year when status and trend scores for an indicator were last updated is displayed on each indicator page, just below the “Status and Trends” heading.
For a quick overview of all indicators and their most recent update dates, you can also refer to the Status and Trend Scorecard, located in the Scorecard section on the main Indicators landing page (just above this FAQ section).
Where can I find information on how indicator status scores were ranked as Good, Fair, or Poor and trend scores were ranked as Improving, No Change, Declining, or Mixed?
Approaches to scores and benchmarks are developed using the best available science. While we aim to standardize approaches to the scoring of indicators as much as possible, each indicator is also unique. When possible, status score benchmarks are based on published literature or specific planning targets. When data or planning targets are limited, benchmarks may be informed by expert judgment and professional consensus. The Technical Appendix outlines both the rationale and sources used to define what qualifies as Good, Fair, or Poor status scores or Improving, Declining, Mixed, or No Change trend scores for that specific indicator.
Where can I find a high-level summary of all the indicators?
- Status and Trends Scorecard – This interactive, filterable table lets you compare all indicators at a glance. It includes each indicator’s definition, current status and trend, year last updated, and a key highlight from the most recent findings.
- Executive Summary (PDF) – This downloadable report provides a high-level overview of the major takeaways across indicators. It also includes a static version of the Scorecard. The Executive Summary will be updated as needed when new status and trend data become available.
Both resources are designed to give you a quick yet meaningful understanding of how the Estuary is doing across a range of environmental indicators.