

Safe for Swimming
Reflects the level of pathogens (microscopic organisms that can cause illness) in Estuary water

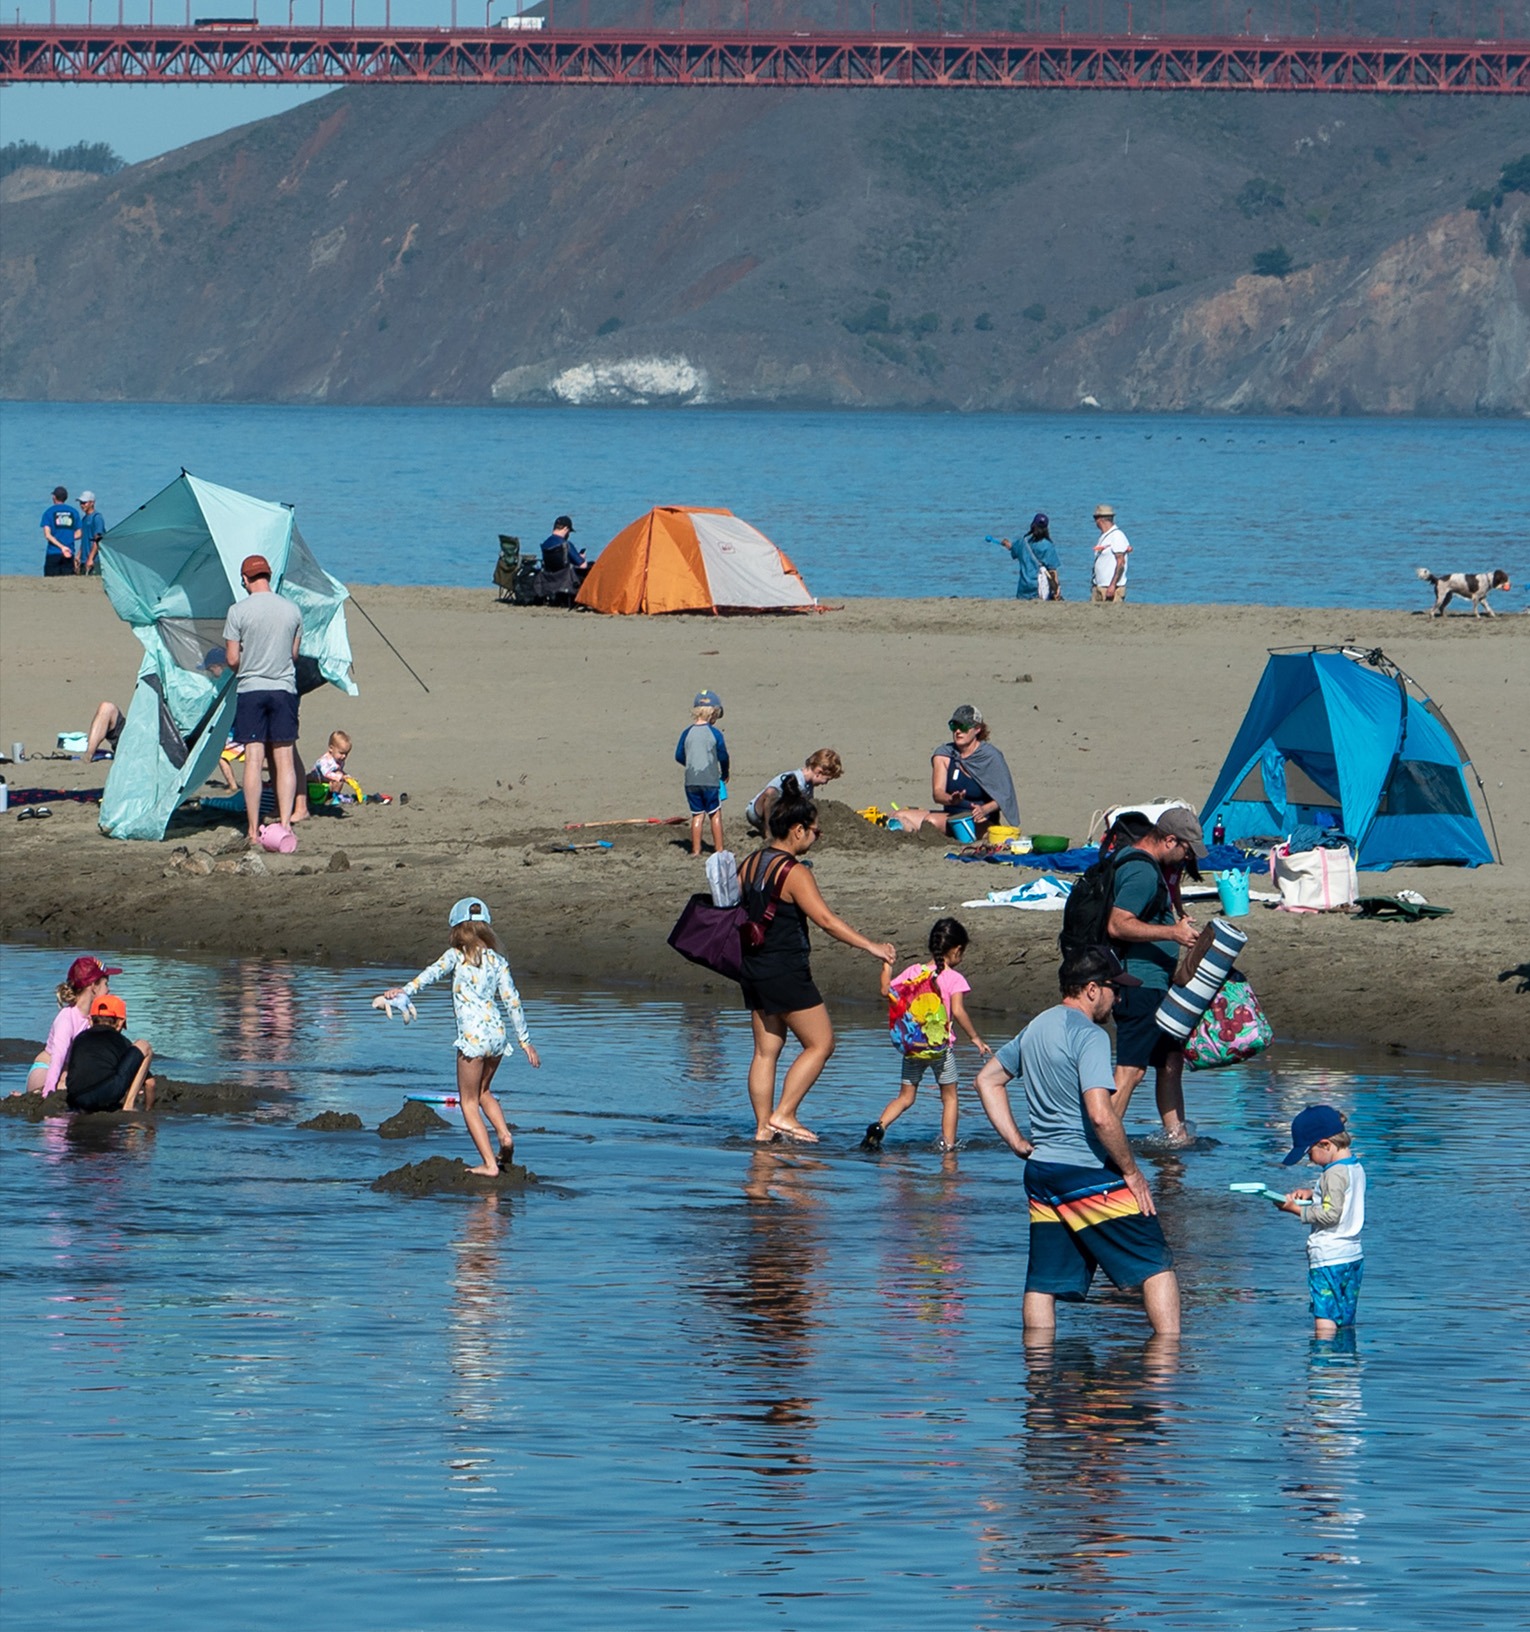
Children enjoying the shoreline. CC0 1.0.
Safe Water Allows People to Enjoy Their Beaches
Safe for Swimming
Status & Trend
Latest Update: October 2025
This indicator uses data from Heal the Bay, which translates FIB monitoring data into Beach Report Cards that use a familiar A through F grading scale. The Bay’s average summer grade for 30 beaches in 2023 was a B+ (Grade Point Average or GPA of 3.36). The average summer grade has been at approximately this level since 2012. The average grade for 32 beaches in wet weather in 2023 was a B (GPA of 3.10; data not shown).
Full read
Safe for Swimming in Depth
While most Bay beaches have bacteria concentrations that meet water quality standards, some beaches fail to meet standards (see summary in Table 2 in the Technical Appendix, below). For example, in 2023, eight of the 30 beaches monitored in the summer had grades of B or lower, indicating that bacteria levels exceeded safety standards. Three beaches received a grade of F: Aquatic Park (Marina Lagoon), Lakeshore Park, and Marlin Park. Two beaches received a D: Erckenbrack Park and Gull Park. These D and F grades, all of which occurred at beaches in San Mateo County, indicate an increased risk of illness or infection. These beaches with low grades have problems due to their location in artificially enclosed waters that receive urban runoff and have limited water circulation. During wet weather, four of the 32 beaches monitored had F grades: Lakeshore Park, Erckenbrack Park, Islais Landing, and Mission Creek Park.
Section 303(d) of the 1972 Federal Clean Water Act requires states to list water bodies that do not meet water quality standards and develop action plans, known as Total Maximum Daily Loads (TMDLs), to improve water quality. Many Bay beaches are on the 303(d) List of Impaired Water Bodies because bacteria concentrations exceed water quality standards. TMDL action plans have been developed, or are in development, for many of these problematic beaches. A TMDL was approved in February 2017 to address high bacteria levels at six beaches (China Camp, McNears Beach, Crissy Field, Aquatic Park, Candlestick Point, and Marina Lagoon). Another TMDL is in development for six beaches in San Mateo County (Oyster Point, Coyote Point Park, Kiteboard Beach, Gull Park, Marlin Park, and Erckenbrack Park). Six beaches are on the 303(d) List but are not covered by an existing or planned TMDL: Crown Beach, Encinal Beach, Fort Baker (Horseshoe Cove), Keller Beach, Oakland Inner Harbor, and Paradise Cove.
Potential major bacteria sources to these beaches include municipal stormwater, sewer line leakage, and pet waste. Actions that can reduce bacteria inputs to the Bay include cleaning stormwater collection systems, repairing sewage collection systems, and organizing pet waste campaigns.
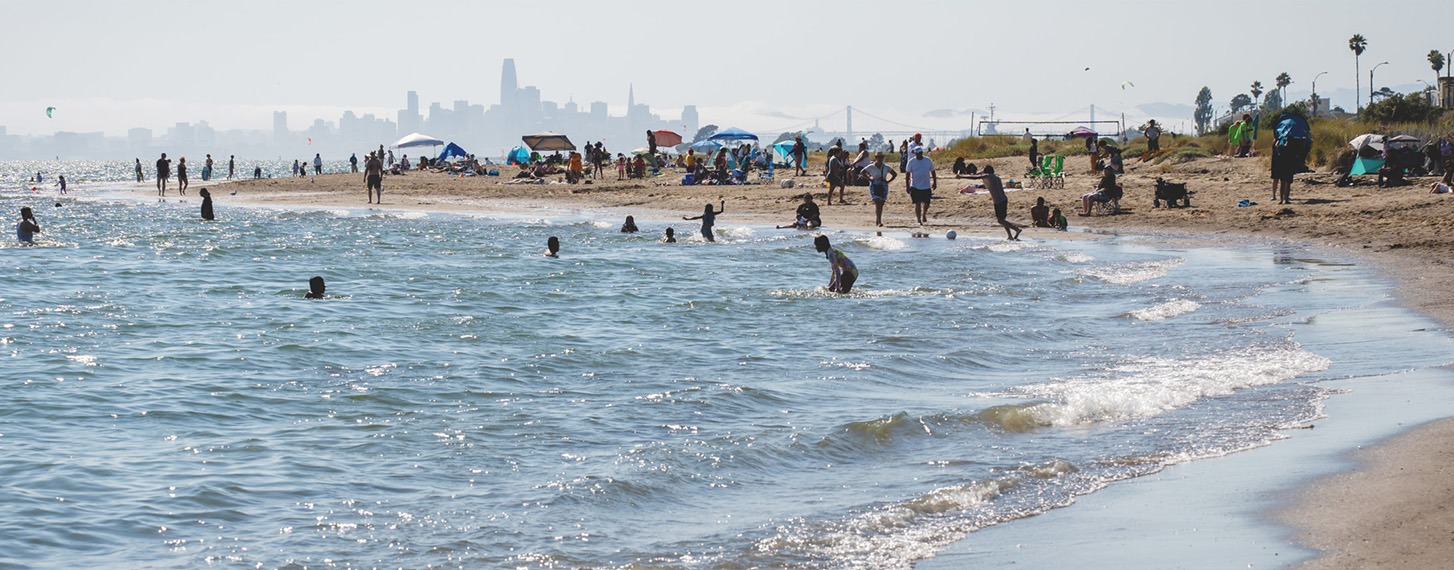
People swimming at Crown Beach in Alameda. Shira Bezalel, SFEI.

How was this Indicator Calculated?
Data Used
Local agency beach bacteria monitoring data, as compiled and assessed by Heal the Bay (Heal the Bay 2024).
Indicator Approach
Heal the Bay (a non-profit based in Santa Monica) has developed an assessment scheme for grading beach water quality throughout California. The safe-to-swim assessment is based on fecal indicator bacteria standards that apply during the summer (April through October) at high-use beaches adjacent to storm drains that flow in the summer.
Heal the Bay’s grading system considers the magnitude and frequency of exceedances above indicator thresholds over the specified time period. Beaches that exceed multiple indicator thresholds (if applicable) in a given time period receive lower grades than beaches that exceeded just one indicator threshold.
Water quality typically deteriorates dramatically during and immediately after a rainstorm, but often rebounds to its previous level within a few days. For this reason, year-round wet weather data throughout California are analyzed separately to avoid artificially lowering a location’s year-round grade and to provide a better understanding of statewide beach water quality impacts.
Benchmarks and Scoring
Our Bay status score is based on Heal the Bay’s assessment scheme for grading beach water quality throughout California. Data for fecal indicator bacteria are compared to state water quality standards and translated into letter grades. The letter grades for approximately 30 San Francisco Bay beaches provide the data for a Bay-wide assessment. The benchmark between Fair and Good is the midway point between grades B and C (2.5), while the benchmark between Fair and Poor is the midway point between grades C and D (1.5).
We determined the Bay trend score by visually assessing temporal patterns in the status scores across the entirety of the time series (2007-2023).
Technical Appendix
Download PDF
Related Indicators
Thriving Communities Category

Access to Nature
Evaluates how access to parks, trails, and open space is distributed across the Estuary (Under development)
Wetland Decision-Making
Evaluates participation in restoration decision-making (Under development)
Safe for Eating
Measures concentrations of toxic contaminants (mercury and polychlorinated biphenyls, or PCBs) in fish from the Estuary
Shoreline Recreational Use
Tracks visitor numbers and activity types in shoreline parks (Under development)
Stewardship & Learning
Tracks the levels of participation in shoreline stewardship and education programs (Under development)
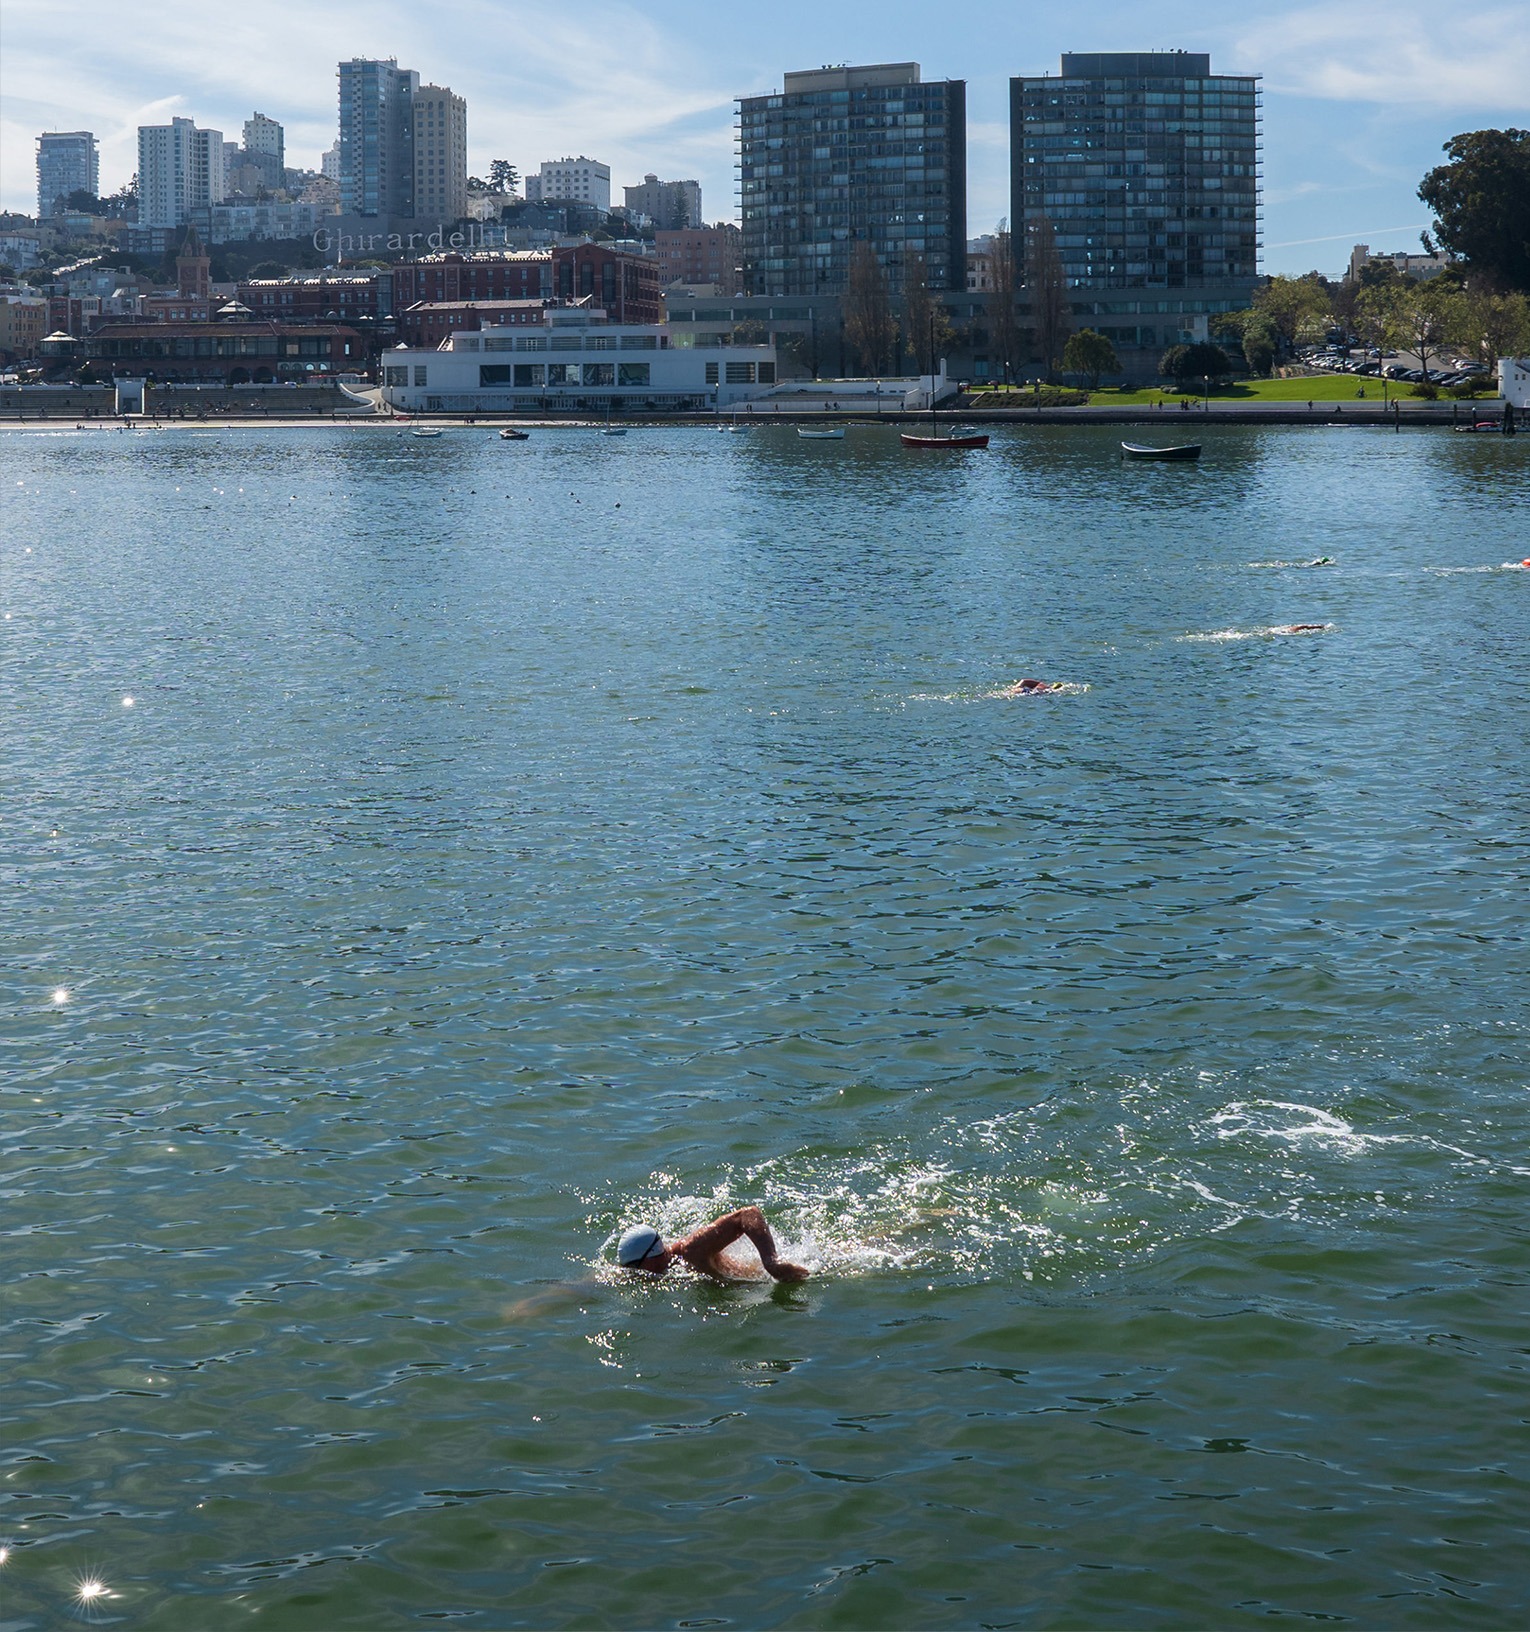
Swimmers train in San Francisco Bay near Ghirardelli Square. Shira Bezalel, SFEI.
Contributing Scientists | Safe for Swimming
Jay Davis, PhD, San Francisco Estuary Institute
Citations
- Heal the Bay. 2024.
“Beach Report Card.” Beach Report Card. https://beachreportcard.org/