
Shorebirds
Tracks winter densities of migratory shorebirds in the San Francisco Bay

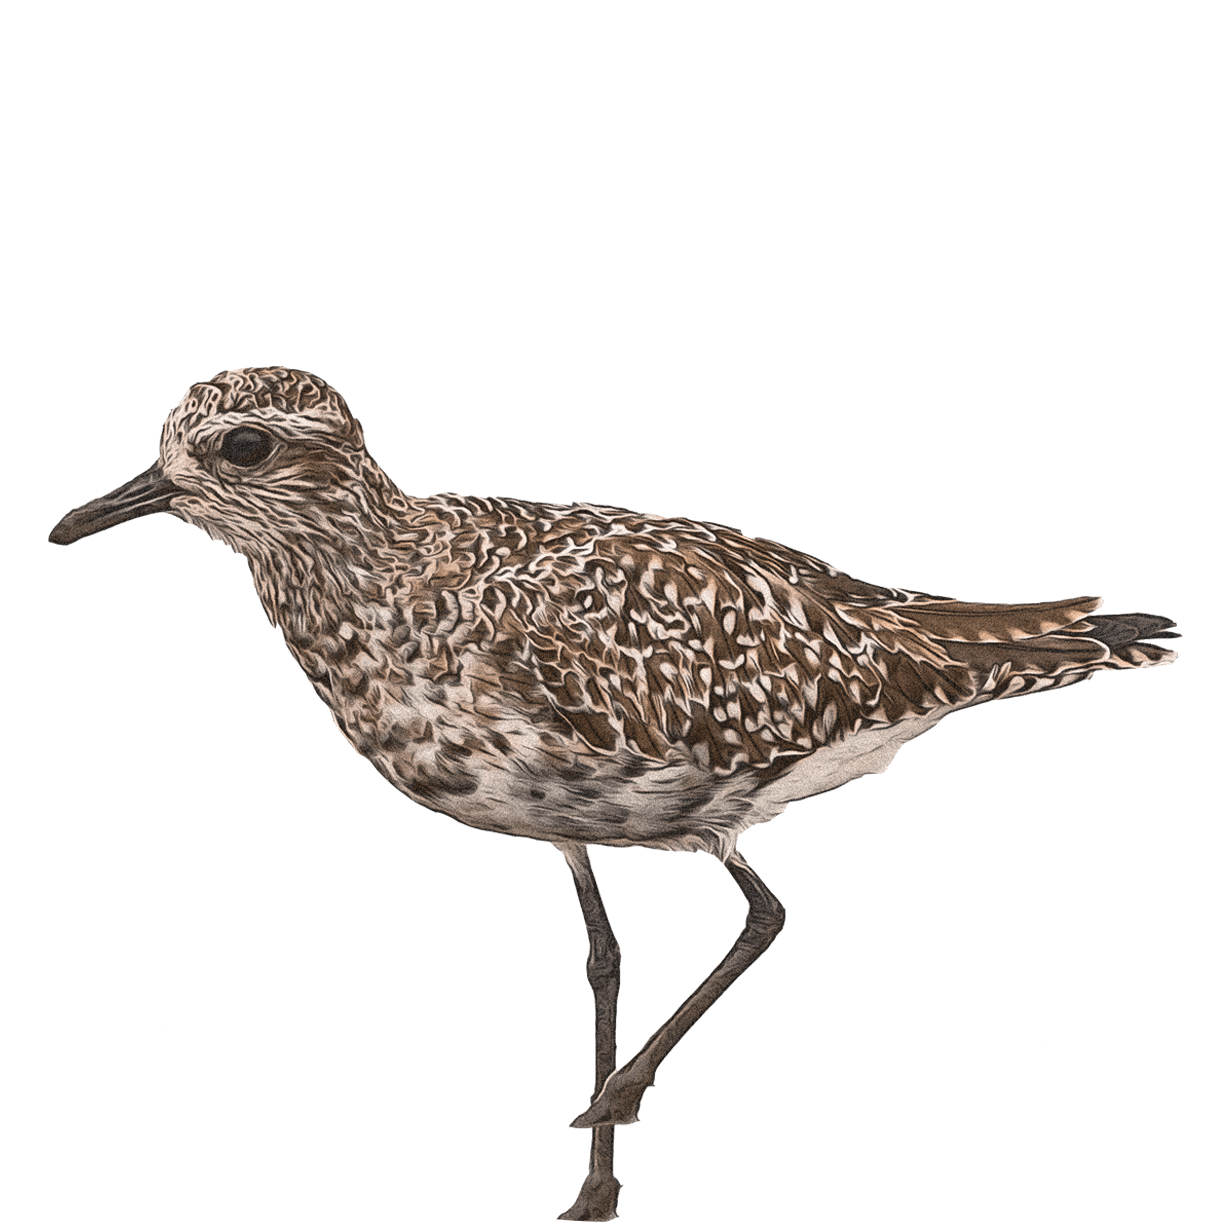
Black-bellied Plover. Becky Matsubara. CC BY 2.0. Cropped, colored, textured.
Our Estuary Nourishes Migratory Shorebirds in Winter

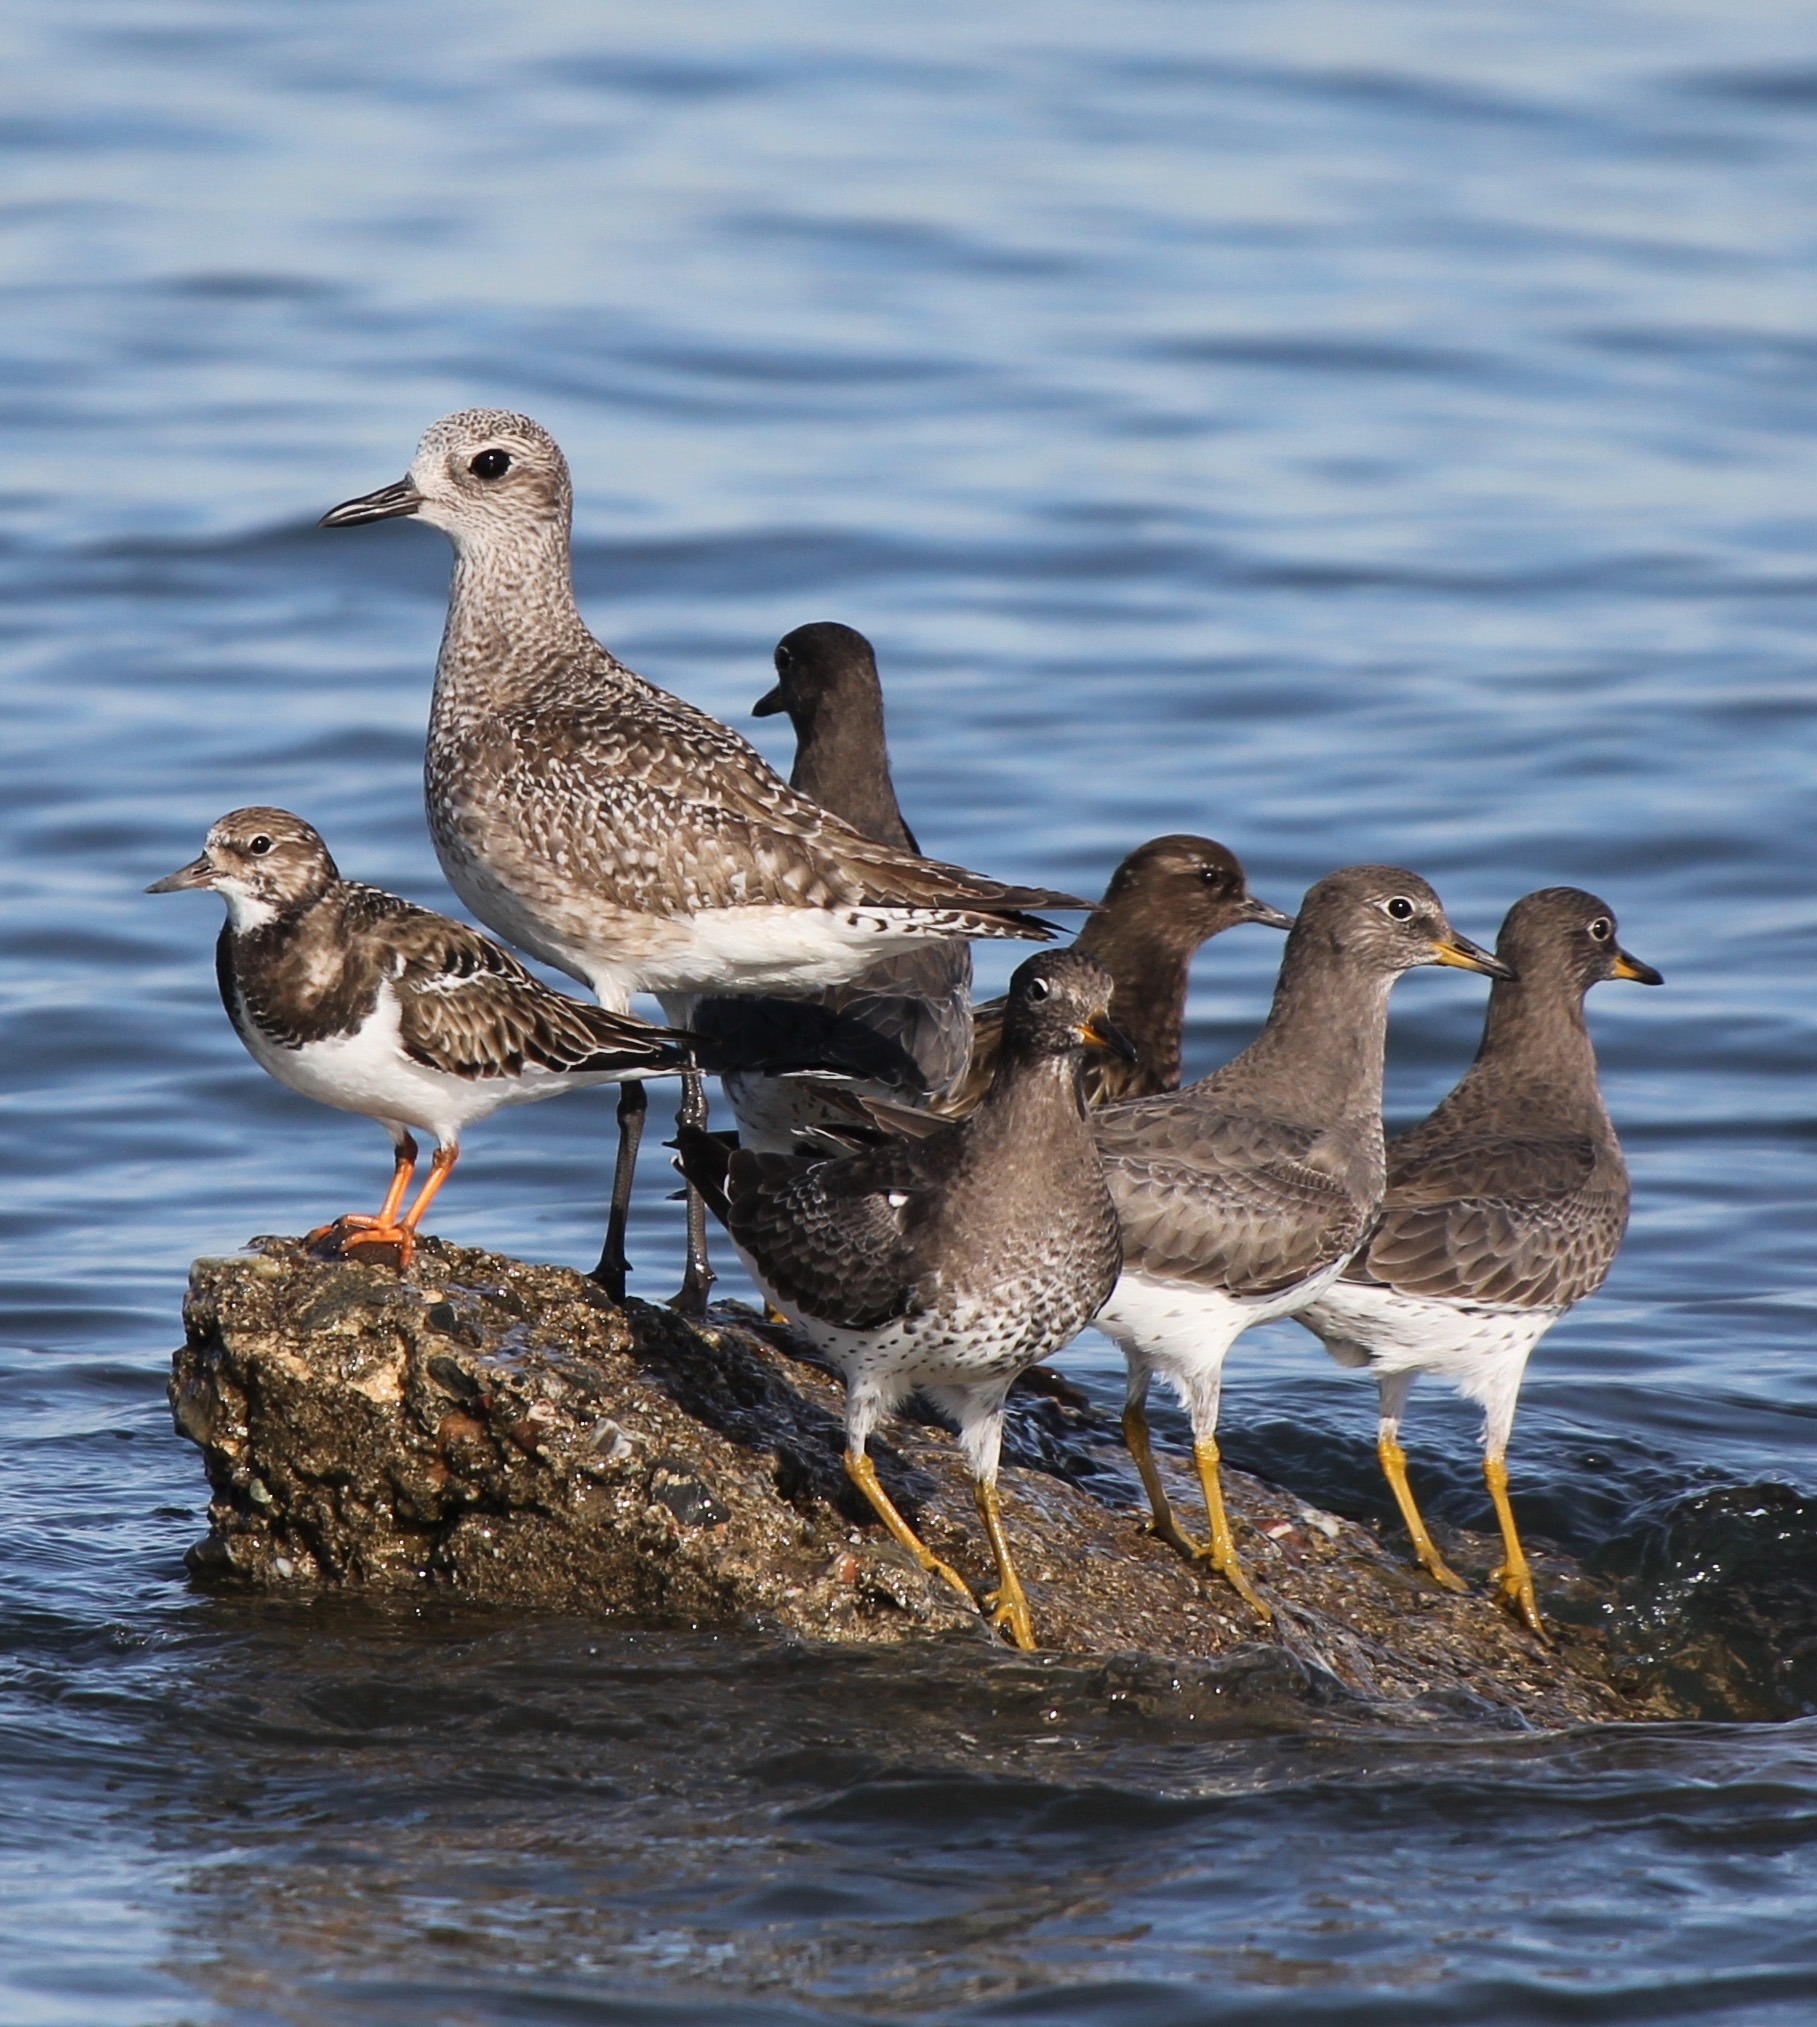
Over 300,000 shorebirds find fuel and refuge in the intertidal mudflats, salt marshes, and saline ponds of the San Francisco Bay each winter. The species that flock to the Estuary use various migratory pathways and breeding ground locations—nesting as far away as the Arctic tundra—making the Bay a site of hemispheric importance for shorebirds in winter.
Shorebirds
Status & Trend
Latest Update: October 2025



Full read
Shorebirds in Depth
Shorebird species wintering in the San Francisco Bay vary greatly in body size and abundance, as well as in the latitude of their breeding grounds along the Pacific Flyway. The nine species representing this indicator composed 96% of the shorebirds counted in bay-wide surveys during the baseline years (2006-2008; Wood et al. 2010).
The overarching pattern of declining winter shorebird populations in the Bay is of concern. Consistent patterns across shorebird body size groups that breed in different latitudes along the Pacific Flyway suggest that changes in densities may be driven by winter conditions in the Bay, and recent studies have pointed to declining shorebirds at nearby sites (Warnock et al. 2021) and within the region (Munoz-Salas et al. 2023). However, shorebird declines are also being recorded across the Pacific Flyway (Reiter et al. in press, Donlan et al. 2024), suggesting there may be hemispheric-scale factors at play. Whether the changes in the densities of shorebirds in San Francisco Bay are the result of changes in the condition of the Bay, changes across the broader Flyway, or changes in both is still not clear. High variation in annual counts also muddies the picture, and ongoing annual monitoring of randomly selected sites and periodic bay-wide comprehensive surveys are needed to better understand the year-to-year variation observed.
The acreage and condition of wetlands in San Francisco Bay have changed tremendously in recent decades, particularly in the South Bay, where the restoration of former salt ponds to tidal marsh has changed the composition of habitats since the baseline years. There have also been changes to habitat availability in the North Bay (e.g., breaching of levees) during the last 10 years. Additional research is needed to understand whether habitat alterations in the North and South Bay are contributing to declines in shorebirds. See partner effort San Francisco Bay State of the Birds for a robust discussion of these habitat-based patterns.
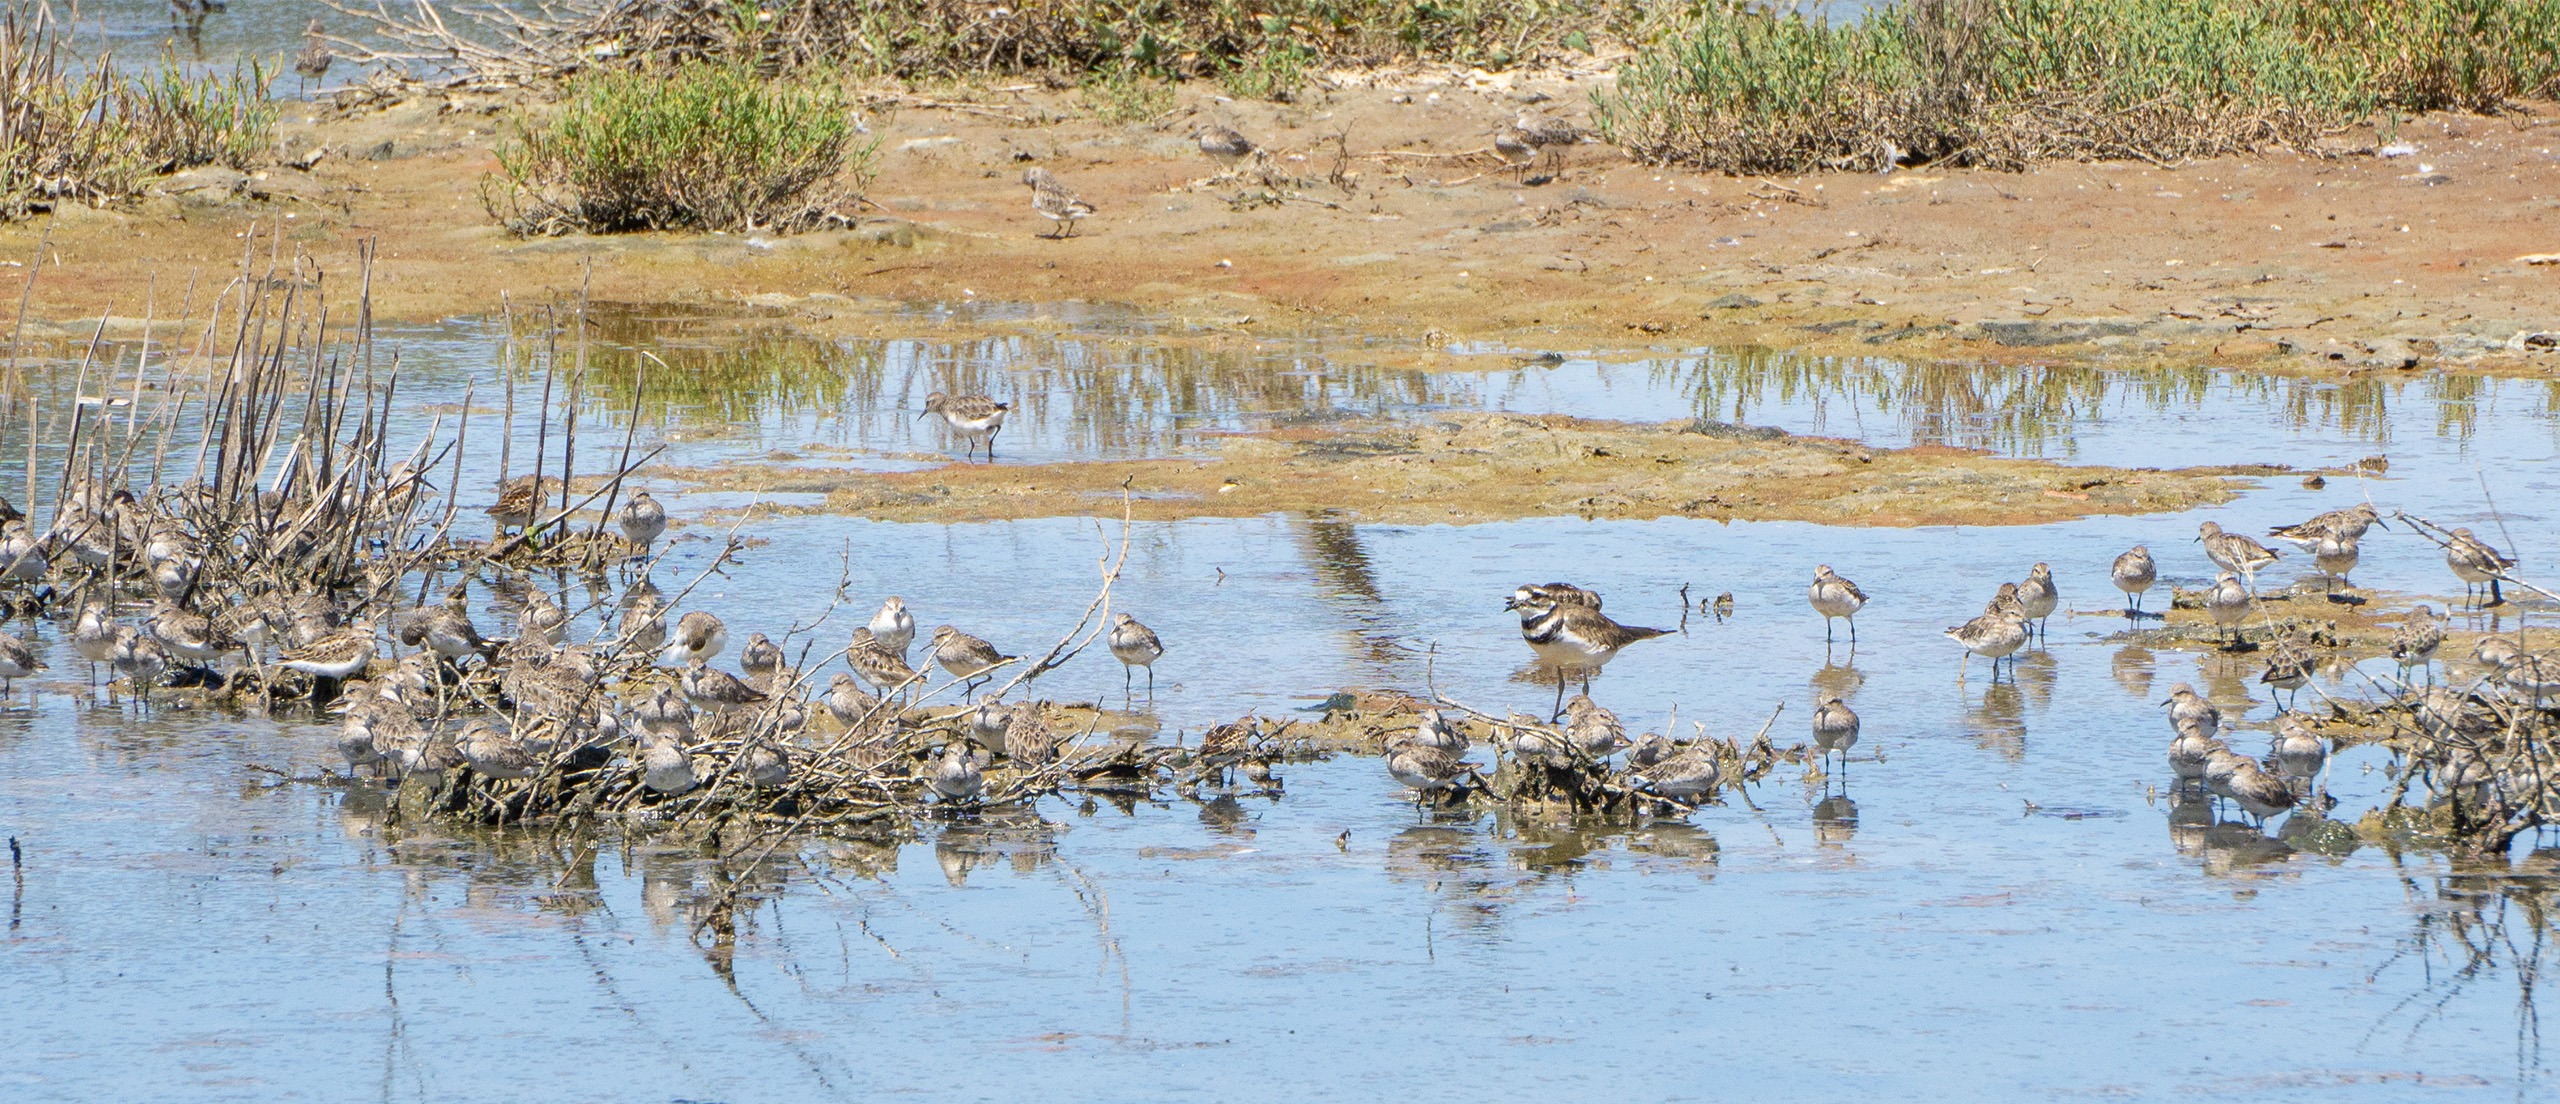
Shorebirds forage in a marsh. Ben Botkin, San Francisco Estuary Partnership.
How was this Indicator Calculated?
Data Used
We used a high-tide November-December subset of data collected annually since 2006 as part of the Pacific Flyway Shorebird Survey (Point Blue 2025).
Indicator Approach
We used data from 101 randomly selected sites surveyed in 2006-2008 and 2021-2023 from around the San Francisco Bay (Wood et al. 2010, Reiter et al. 2011). We selected three species to represent each of the three body size/breeding latitudes sub-groups analyzed:
- American Avocet (Recurvirostra americana), Willet (Tringa semipalmata), and Marbled Godwit (Limosa fedoa) represented large-bodied, generally temperate breeding birds.
- Black-bellied Plover (Pluvialis squatorola) and Short- and Long-billed dowitchers (Limnodromus griseus, L. scolopaceus) represented medium-bodied, mid- to high-latitude breeding birds.
- Three species of the genus Calidris (Dunlin [Calidris alpina], Western Sandpiper [C. mauri], Least Sandpiper [C. minutilla]) represented small-bodied, high-latitude breeding birds.
We used statistical models to estimate the mean annual population density of these groups for each of three regions of San Francisco Bay (North, Central, and South Bay; as defined by Wood et al. (2010)). For the status analysis, our models compared densities during the baseline period (2006-2008 average) and the current reporting period (2021-2023 average). We used models to estimate long-term trends for each subgroup in each region based on 16 years of available data between 2006 and 2023.
Benchmarks and Scoring
For each of the nine sub-groups, we delineated benchmarks as the value 10% above or below the baseline shorebird density estimate (2006-2008 average), and whether or not the 95% confidence interval for current density estimates (2021-2023 average) overlapped the baseline density estimate. For example, the current mean density estimate for large shorebirds in the North Bay was more than 10% lower than the baseline density estimate for large shorebirds in the North Bay (suggesting a Poor score), but the 95% confidence interval of the current density estimate overlapped the baseline value, so we scored the status for this sub-group as Fair. We selected 2006-2008 as the baseline period because these years represented the state of shorebird populations just prior to a period of substantial change in wetlands in San Francisco Bay from large-scale restoration of saline ponds to tidal marshes.
Our approach to the trend score has changed since the 2015 report, to more closely align with the San Francisco Bay State of the Birds and to take advantage of more available years of data and a more statistically powerful method to track trends. We determined trend scores by evaluating significance of long-term trends (assuming 𝛼 = 0.05); if trends were not significant (i.e., P > 0.05), the trend was scored as No Change.
We determined the overall status and trend score for wintering shorebirds in the San Francisco Bay by tallying scores across the nine sub-groups and assigning the majority score.
Technical Appendix

Download PDF
Related Indicators
Flourishing Wildlife Category

Harbor Seals
Tracks adult harbor seal abundance in the San Francisco Bay during the breeding season (Under development)
Native Fish
Measures the abundance, species diversity, species composition, and distribution of native fishes in the San Francisco Estuary
Ridgway's Rail
Tracks Ridgway’s Rail population density in tidal marsh habitats of the San Francisco Bay (Under development)
Tidal Marsh Birds
An index of breeding population density for three tidal marsh bird species in the San Francisco Bay
Waterfowl
An index of winter abundance for dabbling and diving ducks in the San Francisco Bay
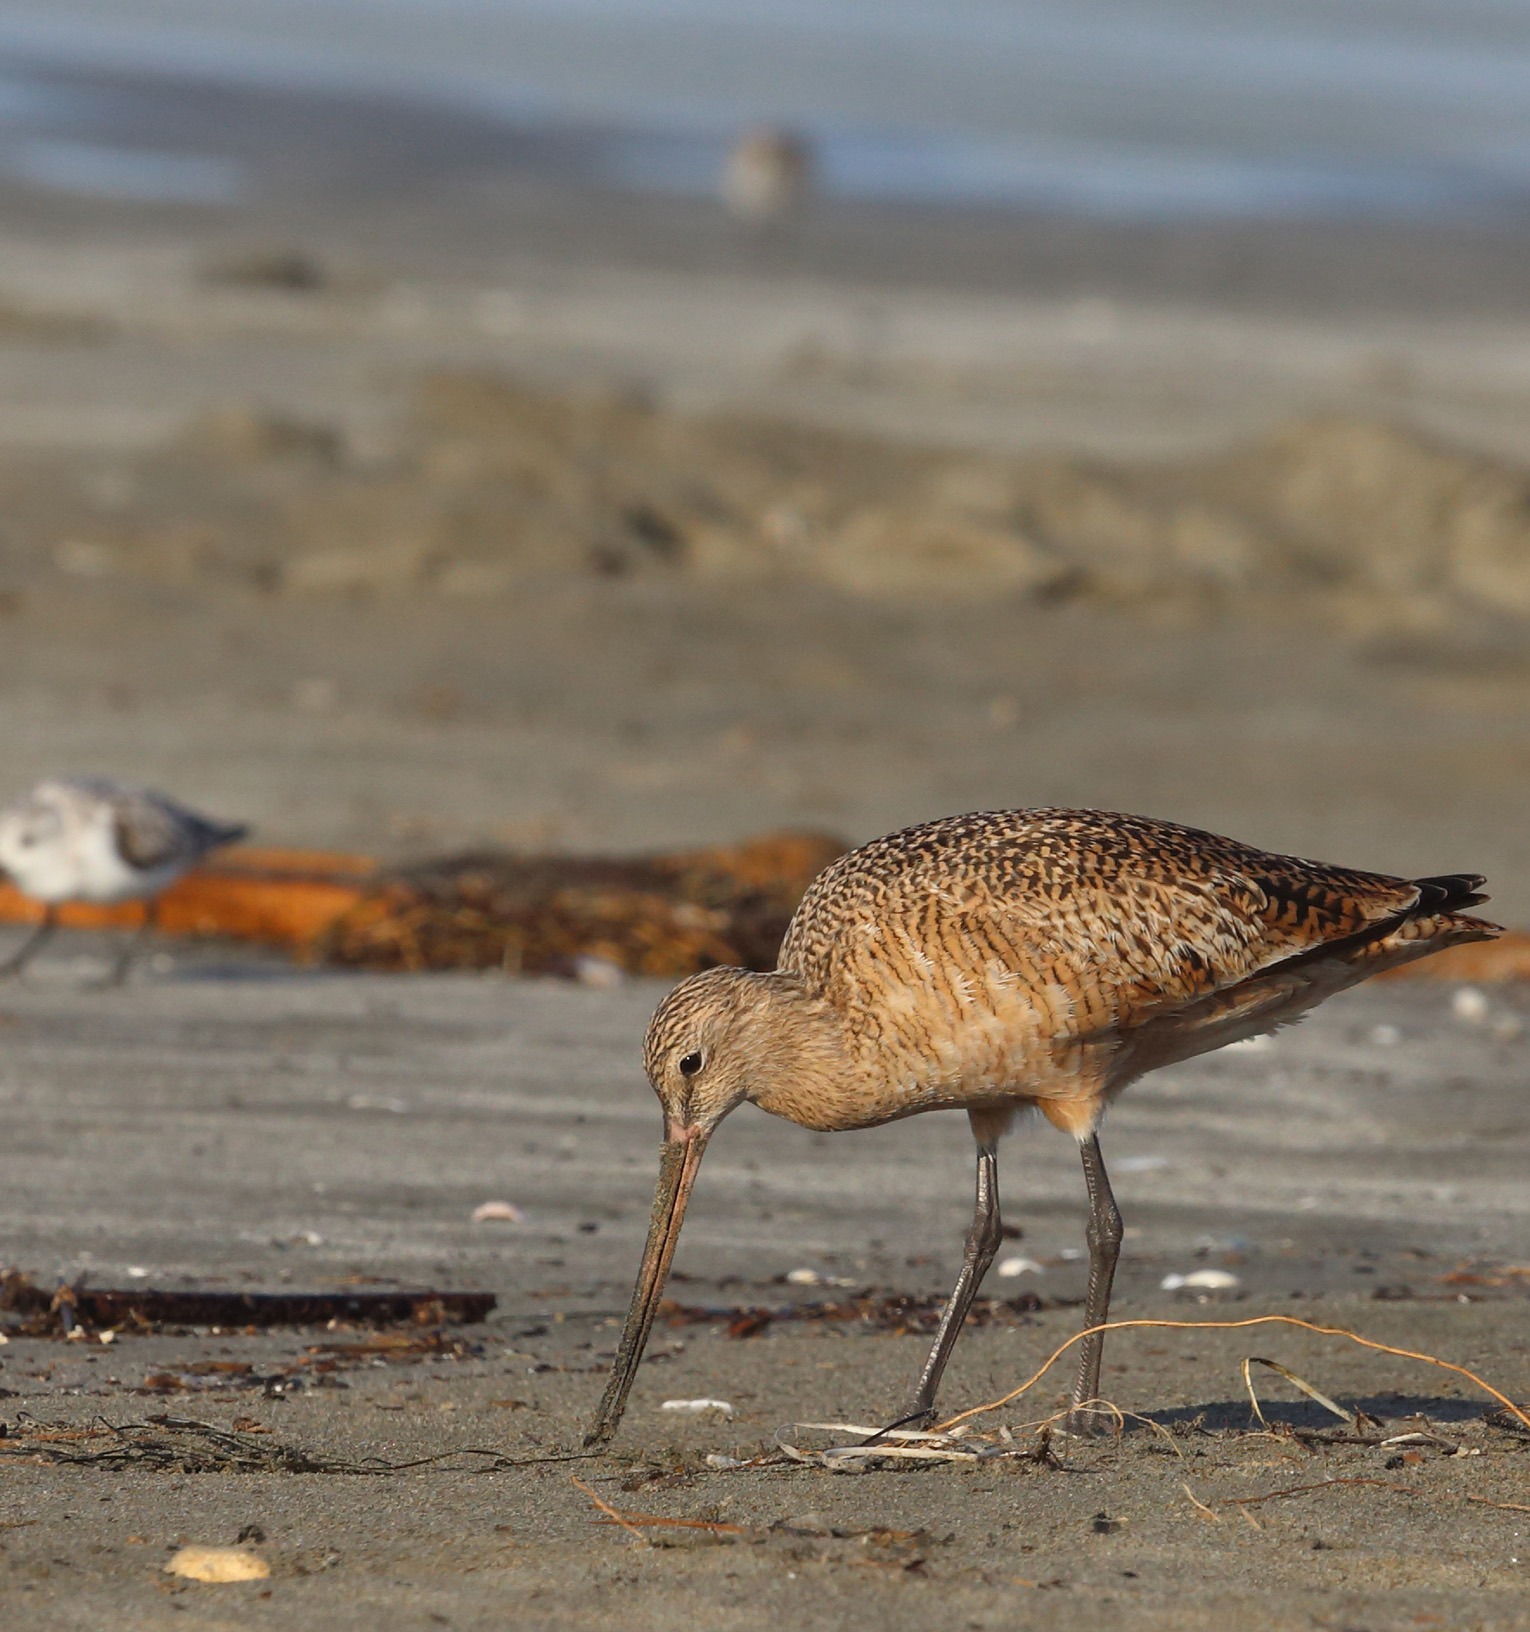
A Marbled Godwit forages on a beach. Don McCullough, Flickr, CC BY 2.0.
Contributing Scientists | Shorebirds
Matthew E. Reiter, PhD, Point Blue Conservation Science
Citations
- Wood, J., G. Page, M. Reiter, L. Liu, and C. Robinson-Nilsen. 2010.
Abundance and distribution of wintering shorebirds in San Francisco Bay, 1990–2008: Population change and informing future monitoring. Report to the Resource Legacy Fund. - Warnock, N., S. Jennings, J. P. Kelly, T. E. Condeso, and D. Lumpkin. 2021.
Declining wintering shorebird populations at a temperate estuary in California: A 30-year perspective. Ornithological Applications 123:duaa060. https://doi.org/10.1093/ornithapp/duaa060 - Muñoz-Salas, E. I., E. Palacios, L. Alfaro, and M. E. Reiter. 2023.
Winter population trends and environmental drivers for three species of temperate shorebirds. Global Ecology and Conservation 46:e02557. https://doi.org/10.1016/j.gecco.2023.e02557 - Donlan, J.D., D. Eusse, G. M. Luque, M. E. Reiter, V. Ruiz-Gutierrez, M. C. Allen, R. Johnston-González, O. J. Robinson, G. Fernández, E. Palacios, and J. Valenzuela. 2024.
An impact evaluation of conservation investments targeting long-distance migratory species. Conservation Biology 38:e14194. https://doi.org/10.1111/cobi.14194 - Point Blue Conservation Science. 2025.
Pacific Flyway Shorebird Survey. https://migratoryshorebirdproject.org/pfss/ - Reiter, M.E. et al. In Press.
Trends in non-breeding shorebirds in the Pacific Flyway 2012–2021. Ornithological Applications.