
Subsided Lands
Tracks land area in the Estuary that has sunk below historical elevation levels and land management practices that reverse or halt the subsidence process

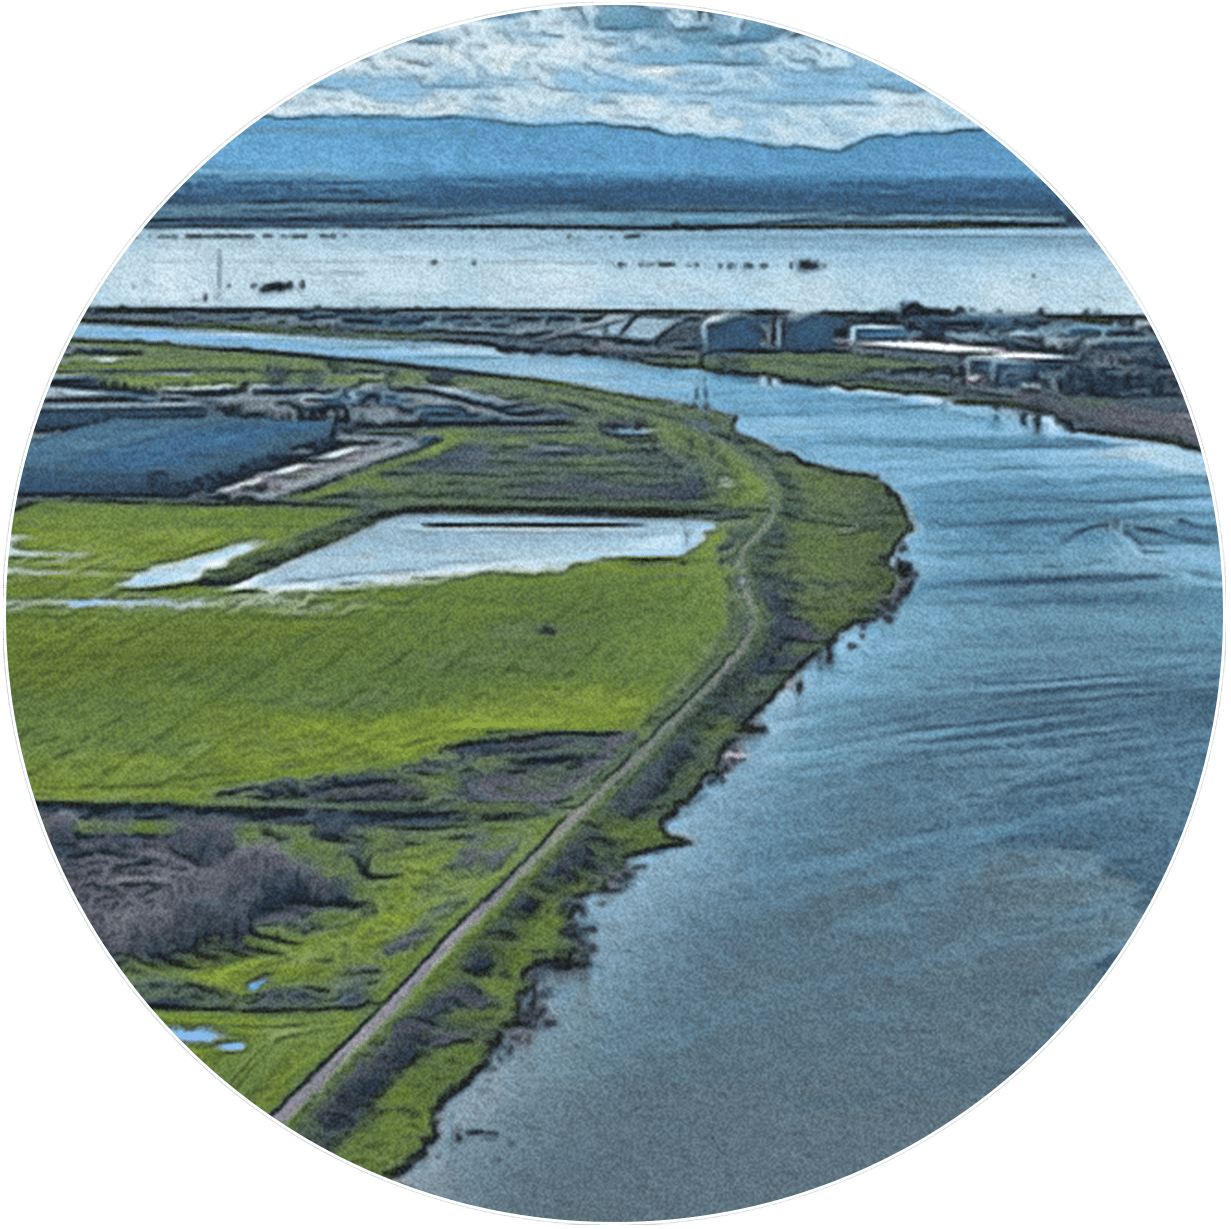
San Joaquin-Sacramento River Delta.
Subsided Lands Leave Communities and Wildlife Habitat Vulnerable to Flooding and Sea Level Rise

Across the Estuary, whole neighborhoods, farms, and parks sit up to 25 feet below sea level—and many are still subsiding. Sunken lands are at greater risk of flooding that could damage homes and cause saltwater intrusion into drinking water. Additionally, in drained wetlands, the soil breaks down, contributing to land subsidence and releasing carbon into the atmosphere.
Subsided Lands
Status & Trend
Latest Update: October 2025

The status of Subsided Lands in the Delta (including Suisun Bay) was Poor, indicating that subsidence management measures are urgently needed. Progress is happening, however, in restoring non-tidal wetlands on deeply subsided lands and planting rice to slow subsidence. The Bay status was Fair, indicating that while more restoration is needed in subsided lands, progress has been made by restoring marshes and reconnecting them with tidal flow. 2025 is the baseline year for this indicator.
Full read
Subsided Lands in Depth
In the Delta, subsidence management entails both subsidence reversal through establishment of managed wetlands and tidally connected marshes, and the slowing or halting of subsidence by conversion of dried lands to “wet” land uses such as rice farming. This indicator tracks both types of management as lands that are likely accreting or minimally subsiding. Some likely accreting projects are taking place in lands that are so deeply subsided that buildup of new material is unlikely to keep pace with sea level rise. However, because these projects provide other benefits such as natural carbon management, we track them alongside other subsidence reversal projects. The Delta indicator provides a snapshot of subsidence management, which complements other regional efforts, namely the Delta Stewardship Council’s Delta Plan Performance Measures 4.12 and 5.2.
In the Bay, subsidence trends are locally variable, driven primarily by groundwater use, tectonic movement, and compaction of landfill underneath developed areas. Management focuses on sediment placement in areas that are subsided, but largely not continuing to sink at rates comparable to the Delta. Thus, in the Bay the indicator is based on subsided area and not projections about future subsidence trends. This indicator does not consider tectonic-driven subsidence or uplift, nor does it include projections about future groundwater use, both major drivers of Bay subsidence. By tracking area of subsidence in the Bay, this indicator complements the Bay Resilience Framework metric for subsided volume at the management unit scale—which is critical to understanding restoration feasibility in the Bay.
Successful restoration of subsided lands is linked to another key process in the Estuary: sediment supply. Restored marshes that are connected to tides need an influx of sediment for plants to trap it, adding to peat that forms as plant matter accumulates. In severely subsided lands and areas where salinity impedes peat building, such as the Bay, manual transport and fill of sediment will be essential to successful restoration. In future State of Our Estuary updates, the Subsided Lands indicator for the Bay will be complemented by the Sediment indicator, and we may change our approach to tracking this indicator.
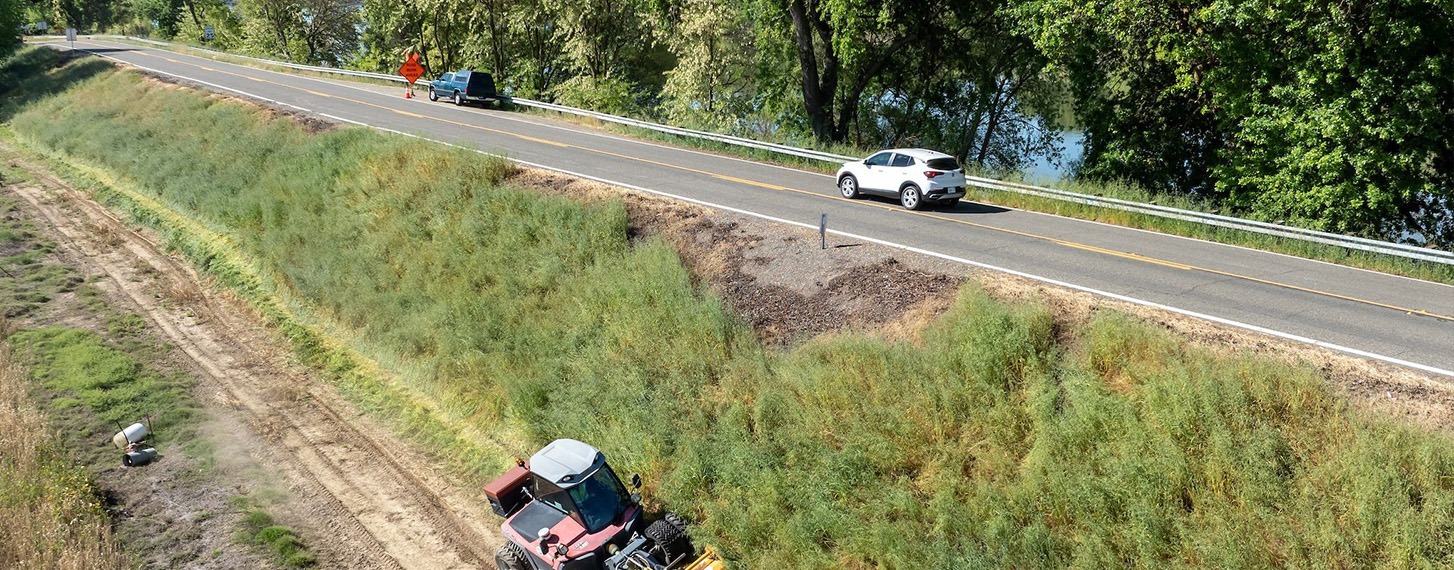
Along California State Route 160, sunken farmland sits vulnerable just beyond the levee—relying on this critical flood barrier to hold back the nearby river. Sara Nevis, California Department of Water Resources.

How was this Indicator Calculated?
Data Used
- Elevation data: 2017 Topobathy (Fregoso et al. 2017), updated with locally available LiDAR (USGS 2019). Tidal datums for regional Mean Higher High Water AECOM (2016) for the Bay and Siegel and Gillenwater (2018) for the Delta.
- Tidal connections and disconnections: Bay Shore Inventory as part of the 2020 Baylands Habitat Map (SFEI 2024), 2017 California Levee Database (CADWR 2017).
- Land Use and Land Cover: Delta Aquatic Resources Inventory (SFEI 2022), 2020 Baylands Habitat Map (SFEI 2024), Department of Water Resources 2020 Crop Mapping (CADWR and LandIQ 2020), and the National Land Cover Dataset (USGS 2021).
- Subsidence reversal project footprints pulled from Project Tracker and aligned with Delta Plan Performance Measures, as of July 2024 (CWMW 2024, DSC 2023; more recent updates from personal communications with Steve Deverel, Lydia Vaughn, and Karen Thorne).
Indicator Approach
We used spatial data on elevation, land use, land cover, and restoration activities to measure the extent of subsided lands at a regional scale (Bay and Delta) and to assess the likelihood of continued subsidence driven by types of land use or land cover (Delta). Land uses and covers within subsided areas in the Delta region that are continually or seasonally dry were assumed to be subsiding, including dry agriculture, urban areas, and managed ponds. We assumed subsidence has slowed or halted in perennially or semi-consistently wetted areas in the Delta region, such as rice fields, channels, muted marshes, unnatural ponds, and lakes (minimally subsiding). Only a handful of subsidence reversal projects (in the ground before 2022) were assessed as likely accreting.
Benchmark and Scoring
In the Bay, we measure the total acreage of subsided lands in order to track changes in the extent of subsidence due to reconnection of restoration projects to tidal action or by additional subsidence. As the total area of the subsided land disconnected from the tides decreases, the assigned score will increase toward Good. We based Bay benchmarks on the 2025 indicator baseline acreage of 69,000 acres (using mapping data from 2020) and the San Francisco Bay Restoration Authority target of 15,000 acres of restoration by 2037. We set the benchmark delineating Poor and Fair at 70,700 acres to capture the baseline acreage plus the potential subsidence reversal due to the 1,700 acres of in-the-ground marsh restoration projects that occurred between the passage of Measure AA in 2016 (when the Restoration Authority began tracking its target) and the 2020 baseline. A score will increase from Fair to Good if the remaining restoration target of 13,300 acres is met in such a way that the amount of subsided lands is reduced to 55,700 acres. The approach to scoring Bay Subsidence Management may change when the Sediment Indicator is completed in future updates.
In the Delta, we measured the total acreage of land that is likely accreting or experiencing minimal change. These two measurements are combined into a single “likely accreting or minimally subsiding” metric. There were only a handful of restoration projects focused directly on subsidence reversal to date, while there are more instances of projects that slow or halt subsidence. If new subsidence mitigation or reversal projects are implemented, we expect the assigned score to increase toward Good as subsiding land acreage decreases. We set benchmarks for the Delta region by summing our current measurement of 25,000 acres of likely accreting or minimally subsiding lands and the target acreage of two Delta Plan Performance Measures for subsidence. The total subsidence management acreage target in the Delta Plan is an additional 36,500 acres, which is the combined acreage for both Delta PM 4.12 and Delta PM 5.2. Thus, we set the benchmark between a Fair and Good status score at 61,500 acres: when the Delta Performance Measures are fully met (36,500 additional acres of new subsidence management projects) + our current measurement of 25,000 acres of likely accreting or minimally subsiding lands. We set the benchmark between Poor and Fair at 43,000 acres: the halfway mark to meeting the Delta Performance Measures target (18,250 additional acres, rounded to 18,000) + our current measurement of 25,000 acres.
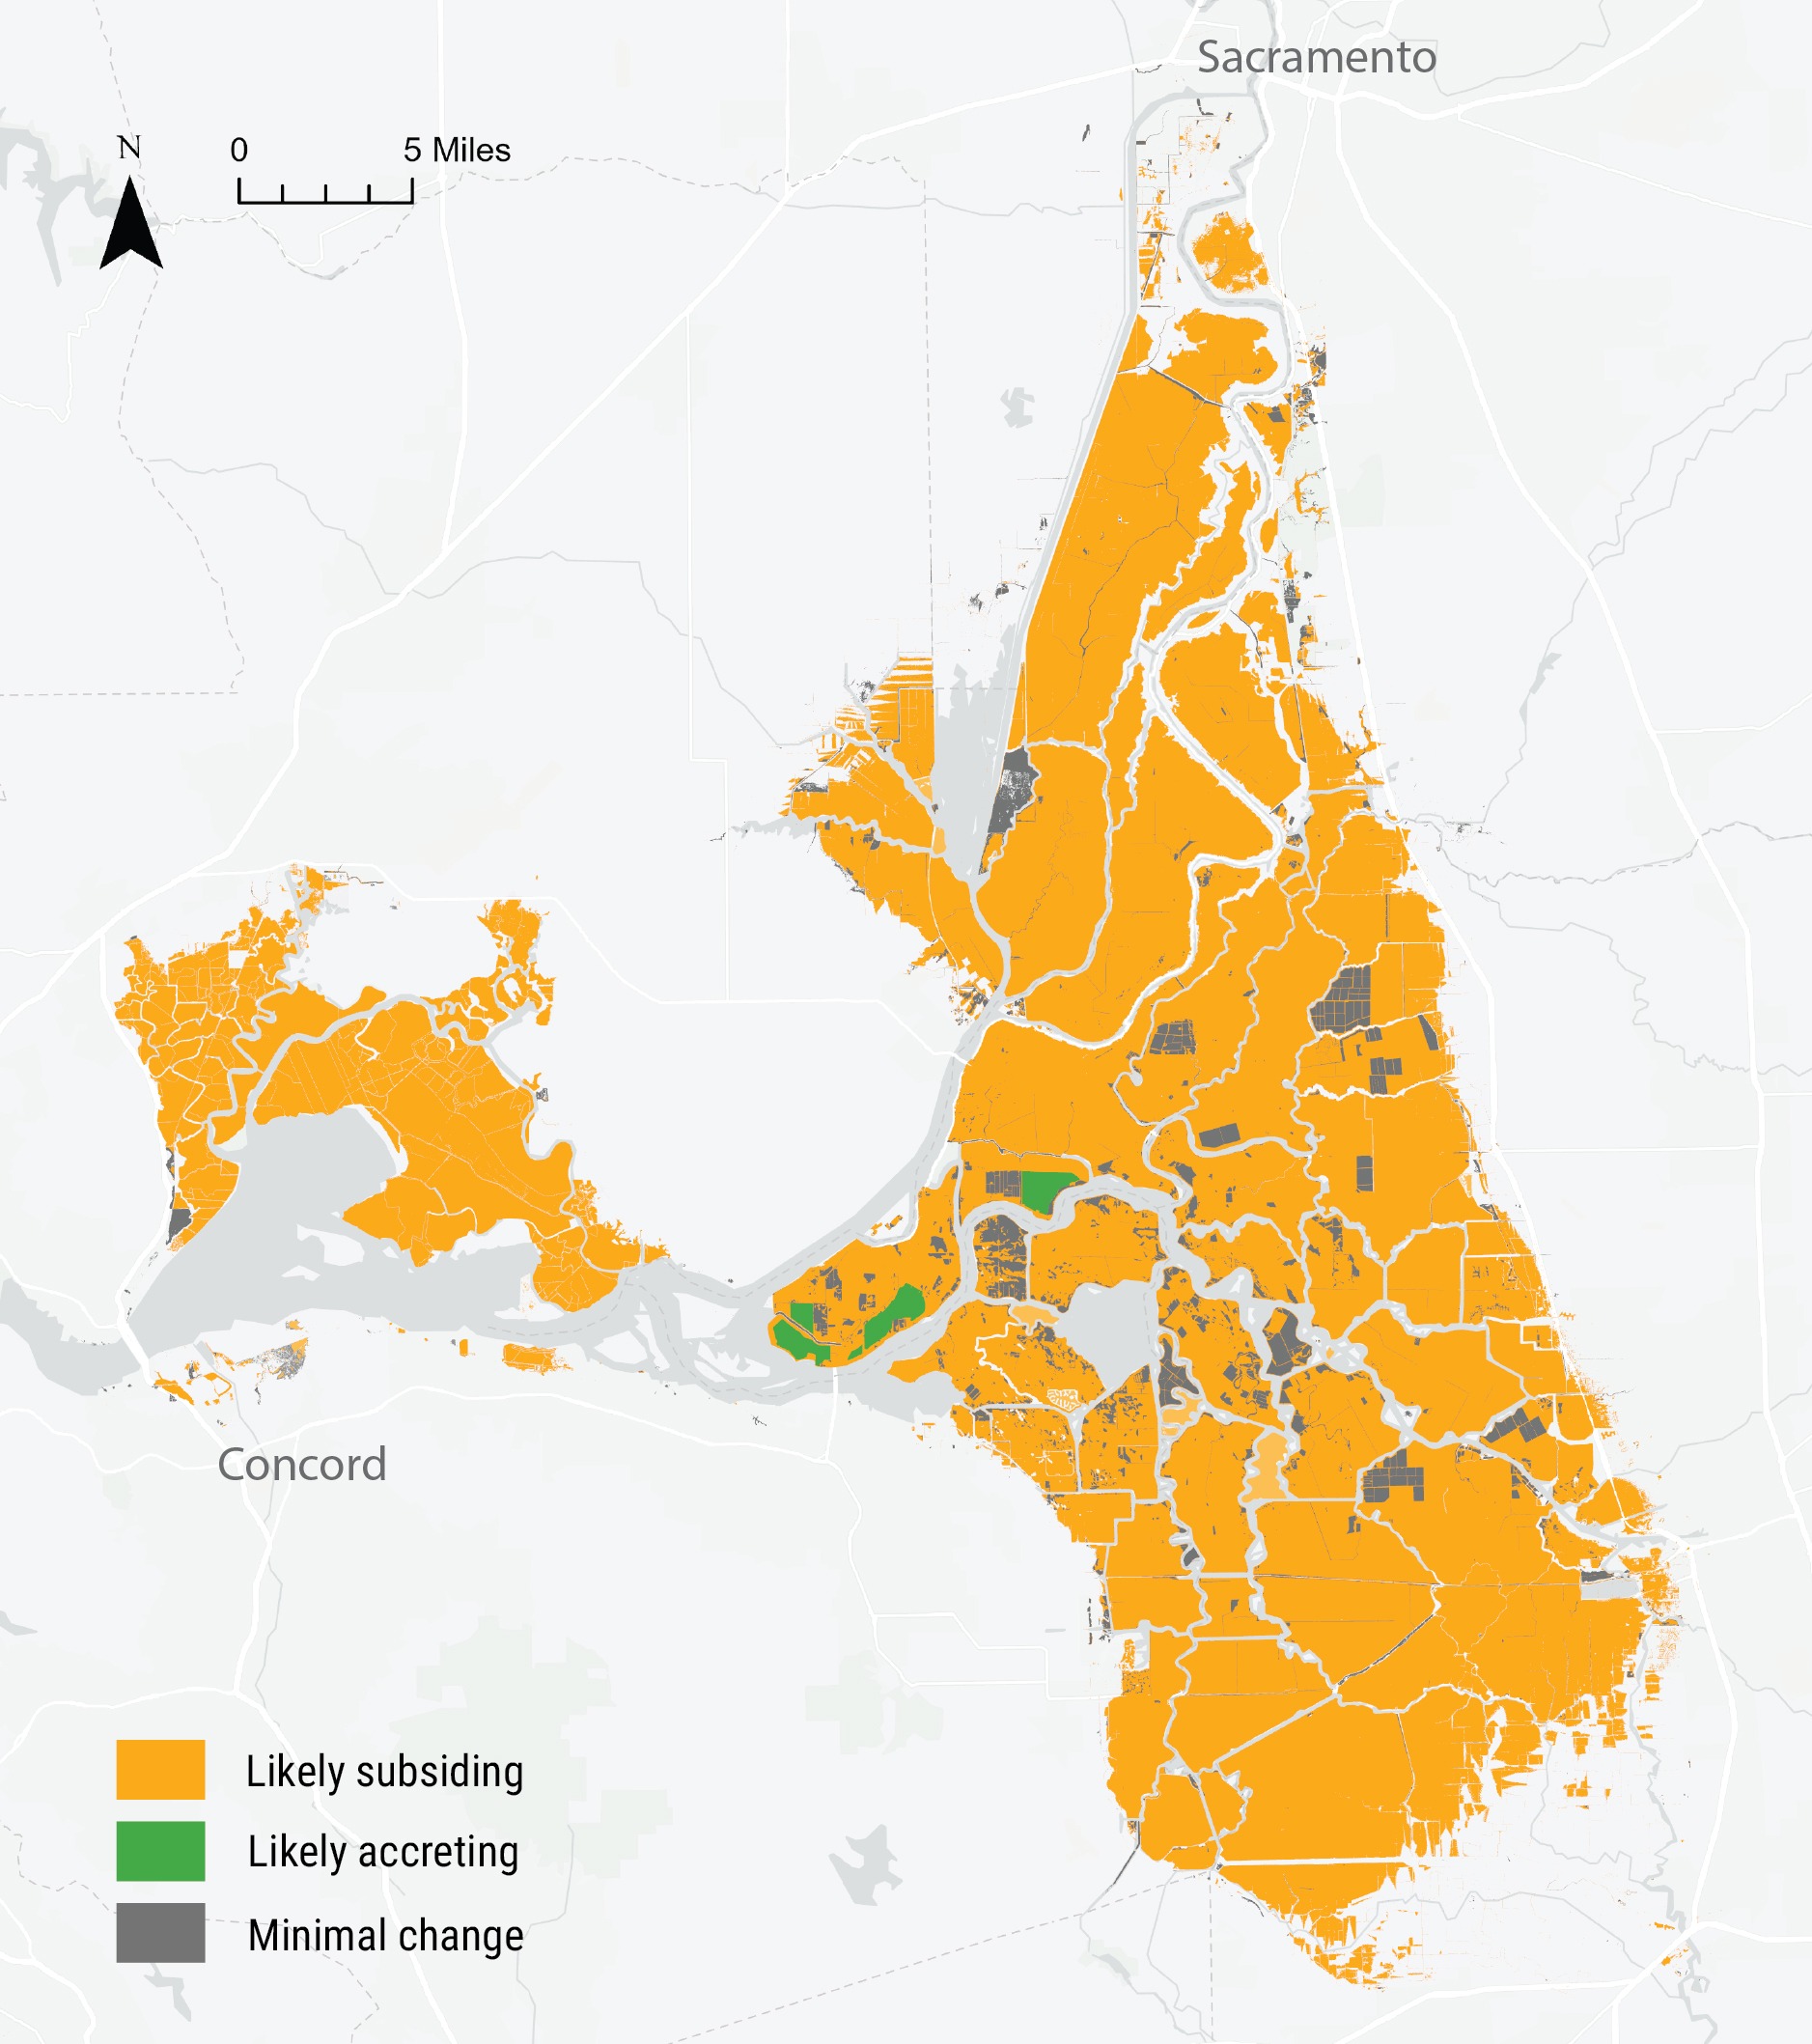
Map of subsidence classification for the Delta (including Suisun) indicating lands likely subsiding and likely accreting or minimally subsiding. Based on land use and land cover data (see Data used section, basemap by ESRI).
Technical Appendix

Download PDF
Related Indicators
Resilient Processes Category
Beneficial Floods
Measures the extent to which freshwater flows create seasonal floodplain habitat upstream of the Delta and low-salinity habitat in the Bay

Migration Space
Measures the amount of protected and undeveloped uplands where tidal habitats can shift inland as sea levels rise (Under development)
Sediment
Tracks sediment supply to existing and restored baylands from natural and engineered sources within San Francisco Bay (Under development)
Soft Shores
Measures the type and distribution of land cover along the shoreline, with undeveloped land ranked as softest
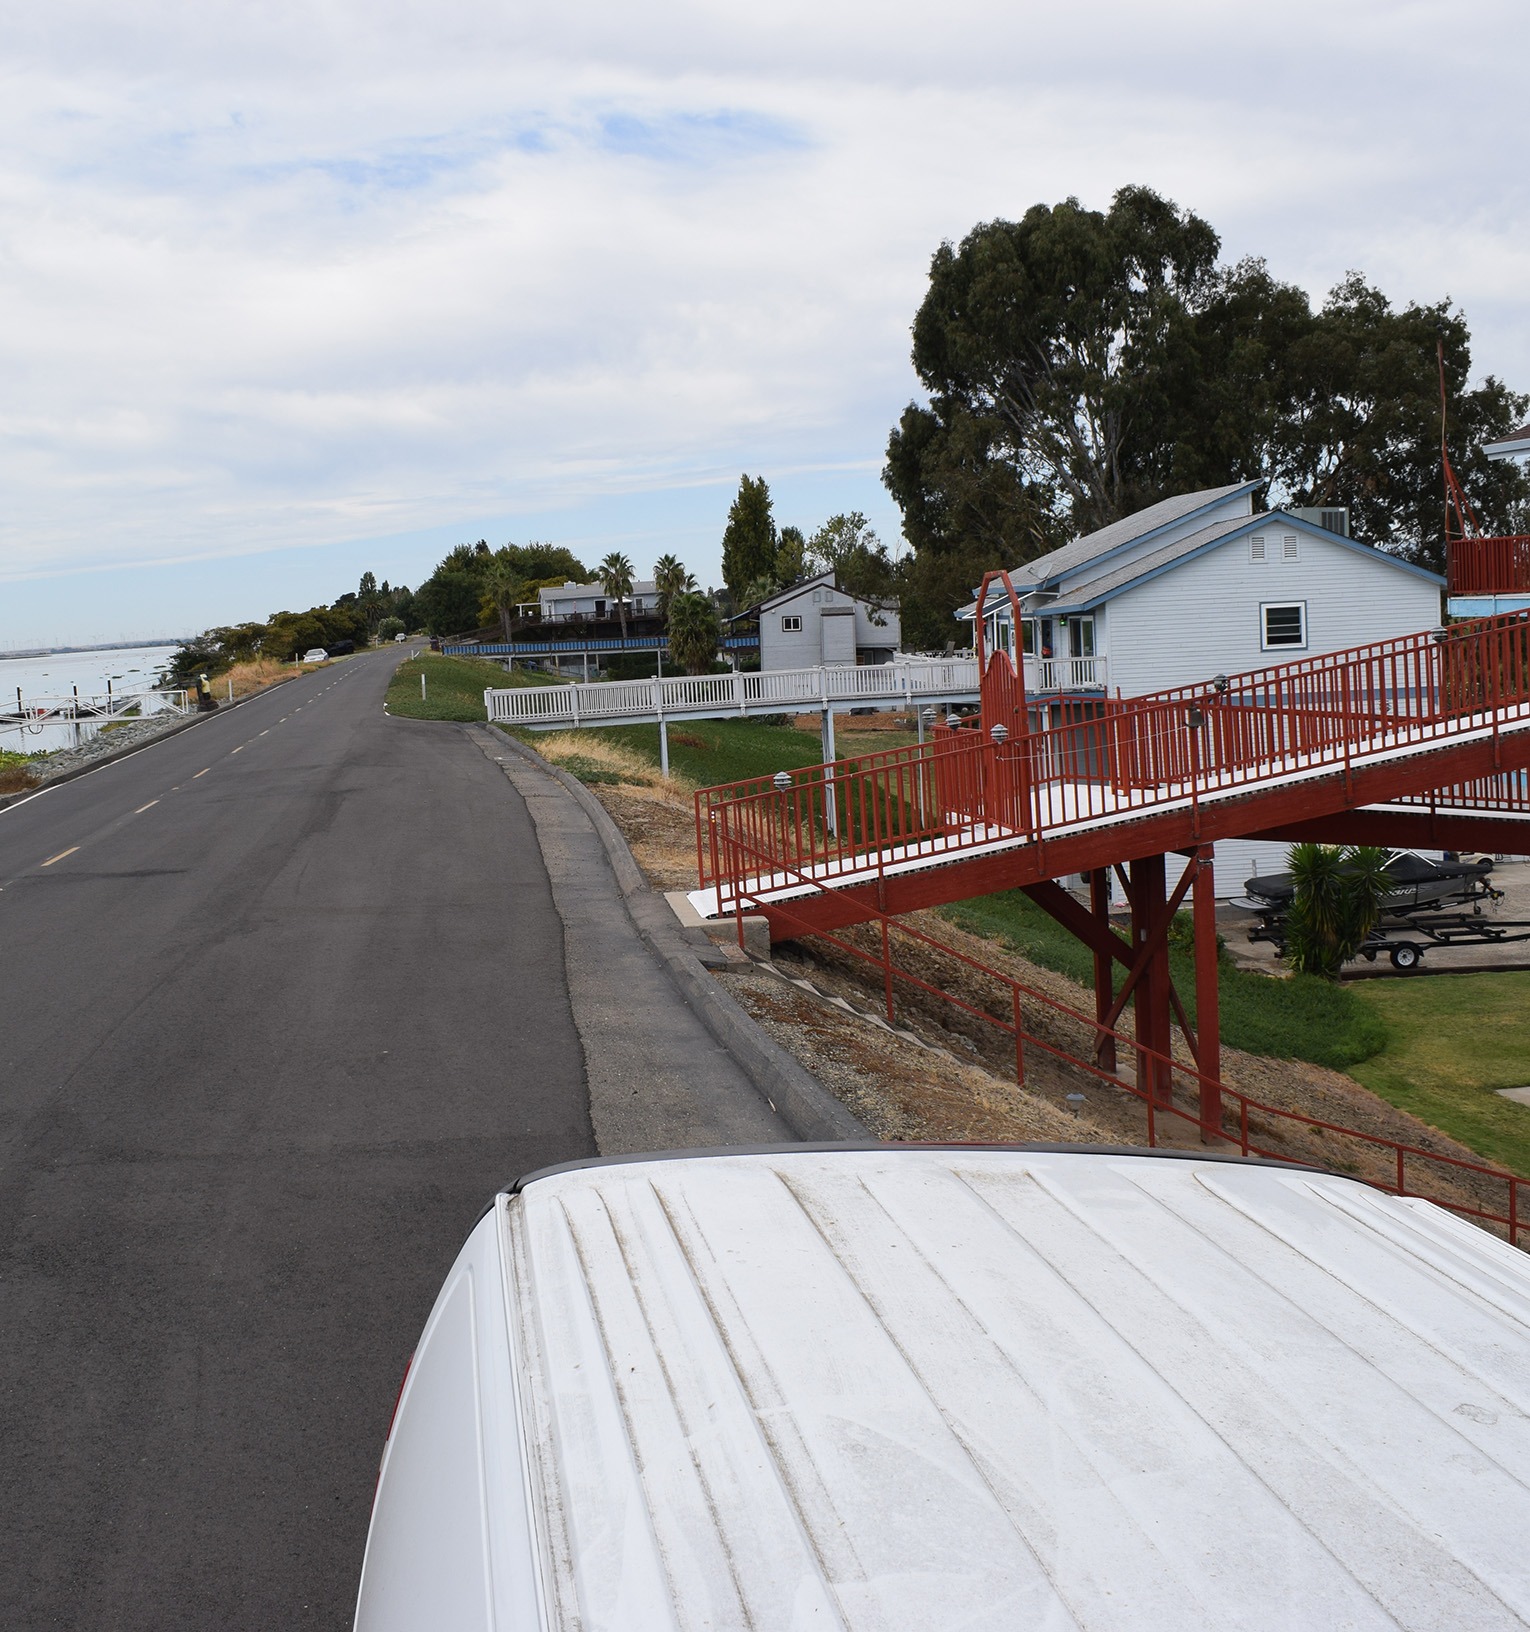
Homes built on subsided land line the San Joaquin River in the Sacramento–San Joaquin Delta. Liz Juvera, San Francisco Estuary Partnership.
Contributing Scientists | Subsided Lands
Cate Jaffe, MEM, San Francisco Estuary Institute
April Robinson, MS, San Francisco Estuary Institute
Lydia Vaughn, PhD, San Francisco Estuary Institute
Citations
- AECOM. 2016.
Tidal datums for the San Francisco Bay. Personal communication. Tidal datum datasets shared directly with SFEI via email. - CADWR [California Department of Water Resources] & LAND IQ. 2020.
2020 Statewide Crop Mapping GIS Geodatabase. Accessed 10/2023. https://lab.data.ca.gov/dataset/statewide-crop-mapping - CADWR [California Department of Water Resources]. 2017.
i17 Delta Levees Anatomy 2017. California Open Data Portal. Accessed 2023. https://data.ca.gov/dataset/i17-delta-levees-anatomy-2017 - CWMW [California Wetland Monitoring Workgroup] & SFEI [San Francisco Estuary Institute]. 2024.
EcoAtlas: Habitat Project Tracker. Accessed 2024. https://ptrack.ecoatlas.org/ - Fregoso, T.A., Wang, R., Alteljevich, E., and Jaffe, B.E. 2017.
San Francisco Bay-Delta bathymetric/topographic digital elevation model (DEM): U.S. Geological Survey data release. http://dx.doi.org/10.5066/F7GH9G27 - Siegel, S. and D. Gillenwater. 2018.
Tidal datums for the Delta. Personal communication data share. - SFEI [San Francisco Estuary Institute]. 2022.
Delta Aquatic Resource Inventory (DARI), Version 1.1 GIS Data. Accessed 10/2024. https://www.sfei.org/data/delta-aquatic-resource-inventory-dari - SFEI [San Francisco Estuary Institute]. 2024.
“Baylands Habitat Map 2020.” Accessed July 2024. https://www.sfei.org/data/baylands-habitat-map-2020-gis-data - USGS [U.S. Geological Survey]. 2021.
National Land Cover Database (NLCD) 2021 Products. https://www.sciencebase.gov/catalog/item/6345b637d34e342aee0863aa - USGS [United States Geological Survey], Woolpert, & DWR [California Department of Water Resources]. 2017.
LIDAR Data for the Sacramento-San Joaquin Delta and Suisun Marsh. June 2019. Accessed 2019. https://gisarchive.cnra.ca.gov/iso/ImageryBaseMapsLandCover/LIDAR/DeltaLIDAR2017/