
Soft Shores
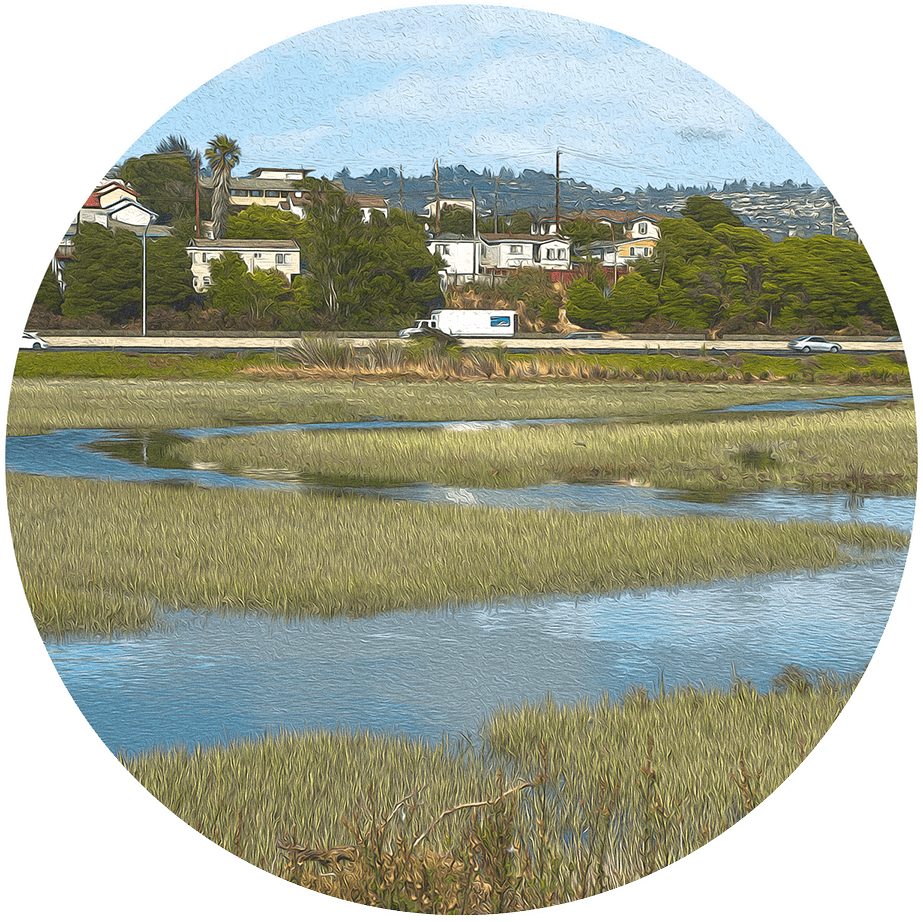
Measures the type and distribution of land cover along the shoreline, with undeveloped land ranked as softest

Tidal Marsh softens the shoreline. Shirea Bezalel, SFEI.
Softer Shorelines Buffer Floods While Offering Space for Wildlife and Recreation

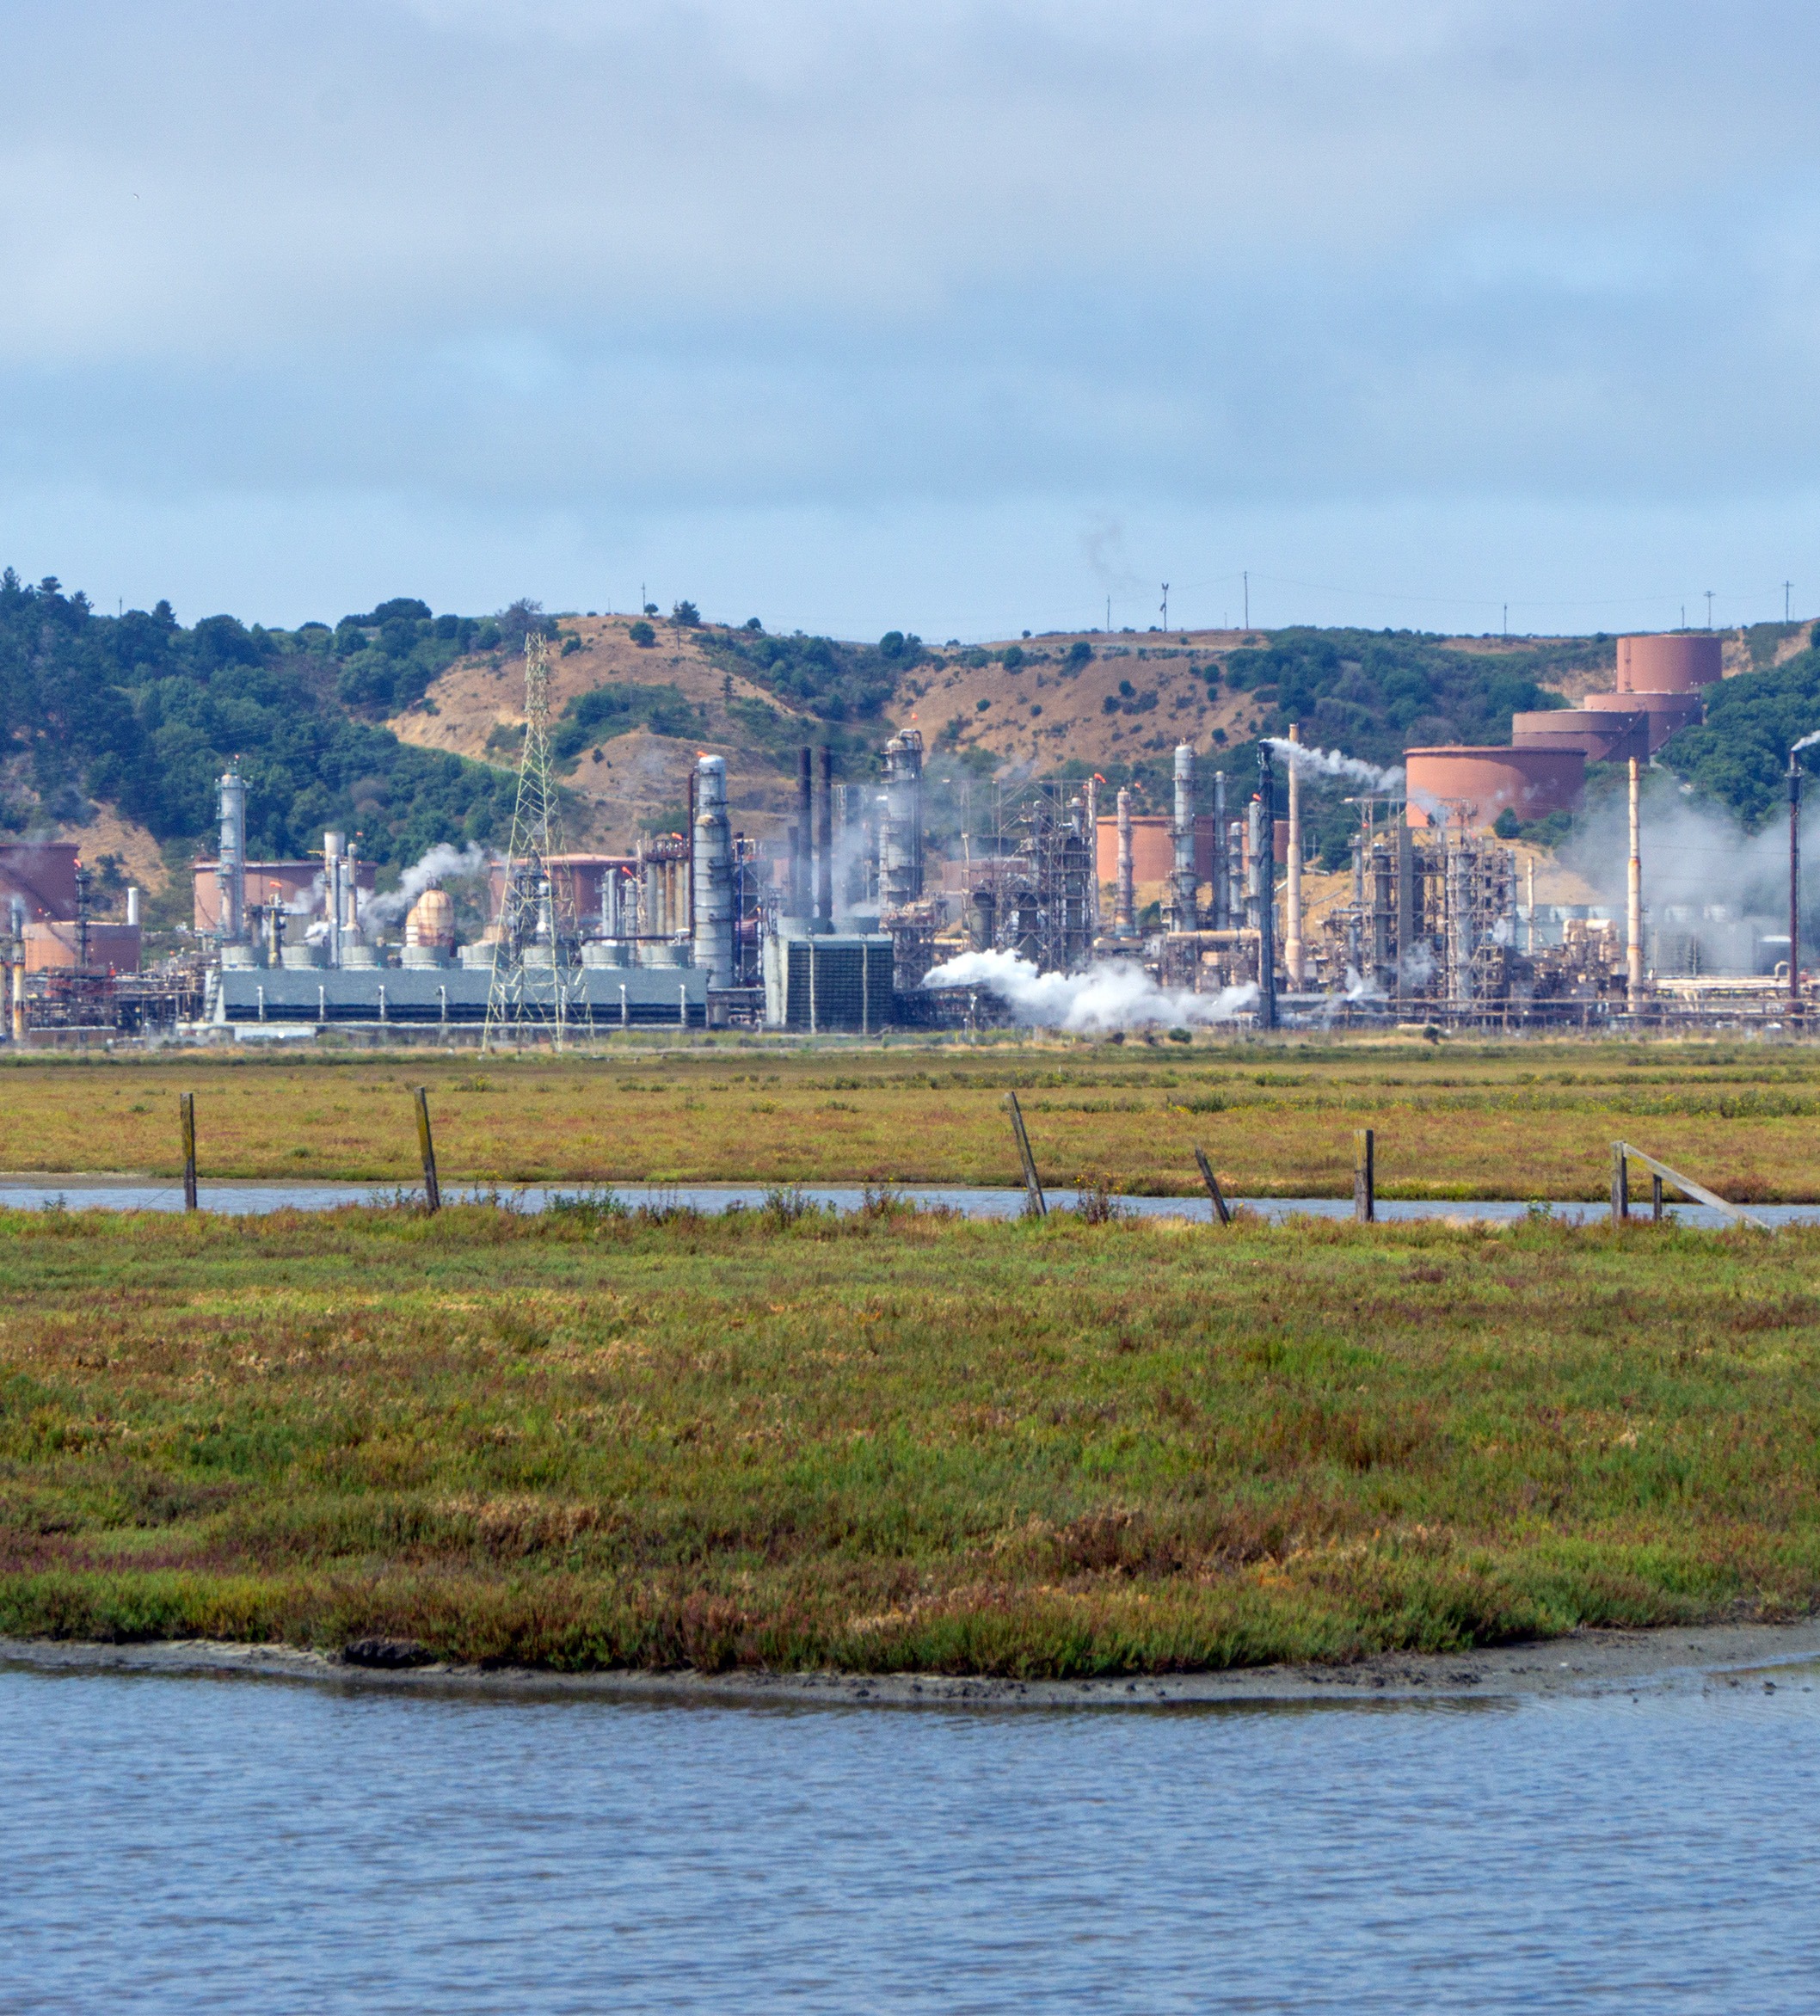
Soft shores provide flood resilience and various co-benefits, including wildlife habitat, natural carbon management, and water quality improvements. Features like marshes and undeveloped land can absorb floodwater and adapt to rising seas, unlike sea walls and levees, which can fail suddenly and irreparably.
Soft Shores
Status & Trend
Latest Update: October 2025



Full read
Soft Shores in Depth
Natural infrastructure, such as marshes, mudflats, beaches, and some terrestrial habitats, also offers flood protection and can adapt and recover without human intervention. These Soft Shore elements are more dynamic than static gray infrastructure because they move with and recover from floods (Hill 2015). Natural infrastructure also provides other benefits, including habitat, natural carbon management, and stormwater pollution treatment. Natural infrastructure can be used alone or to shore up at-risk levees, berms, and flood walls. See SFEI and SPUR (2019) for more examples of how hard and soft shoreline features can be used together.
Soft Shores provides a regional snapshot of dynamic natural infrastructure by quantifying the amount of resilient habitats and land use types that surround the shore. Given the potential of soft shores to offer critical co-benefits for people and wildlife, we track these interventions separately from hardened infrastructure. The Bay Conservation and Development Commission’s Shoreline Vulnerability Index provides a complementary measure of shoreline vulnerability that accounts for protection from soft and hard shorelines.
Many efforts around the Bay encourage the use of soft shore features to alleviate impacts of sea level rise and storm surge. These include but are not limited to The San Francisco Estuary Blueprint, Bay Adapt Joint Platform, and several projects funded through the Delta Conservancy’s Nature-Based Solutions: Wetland Restoration Funding (Delta Conservancy 2025).
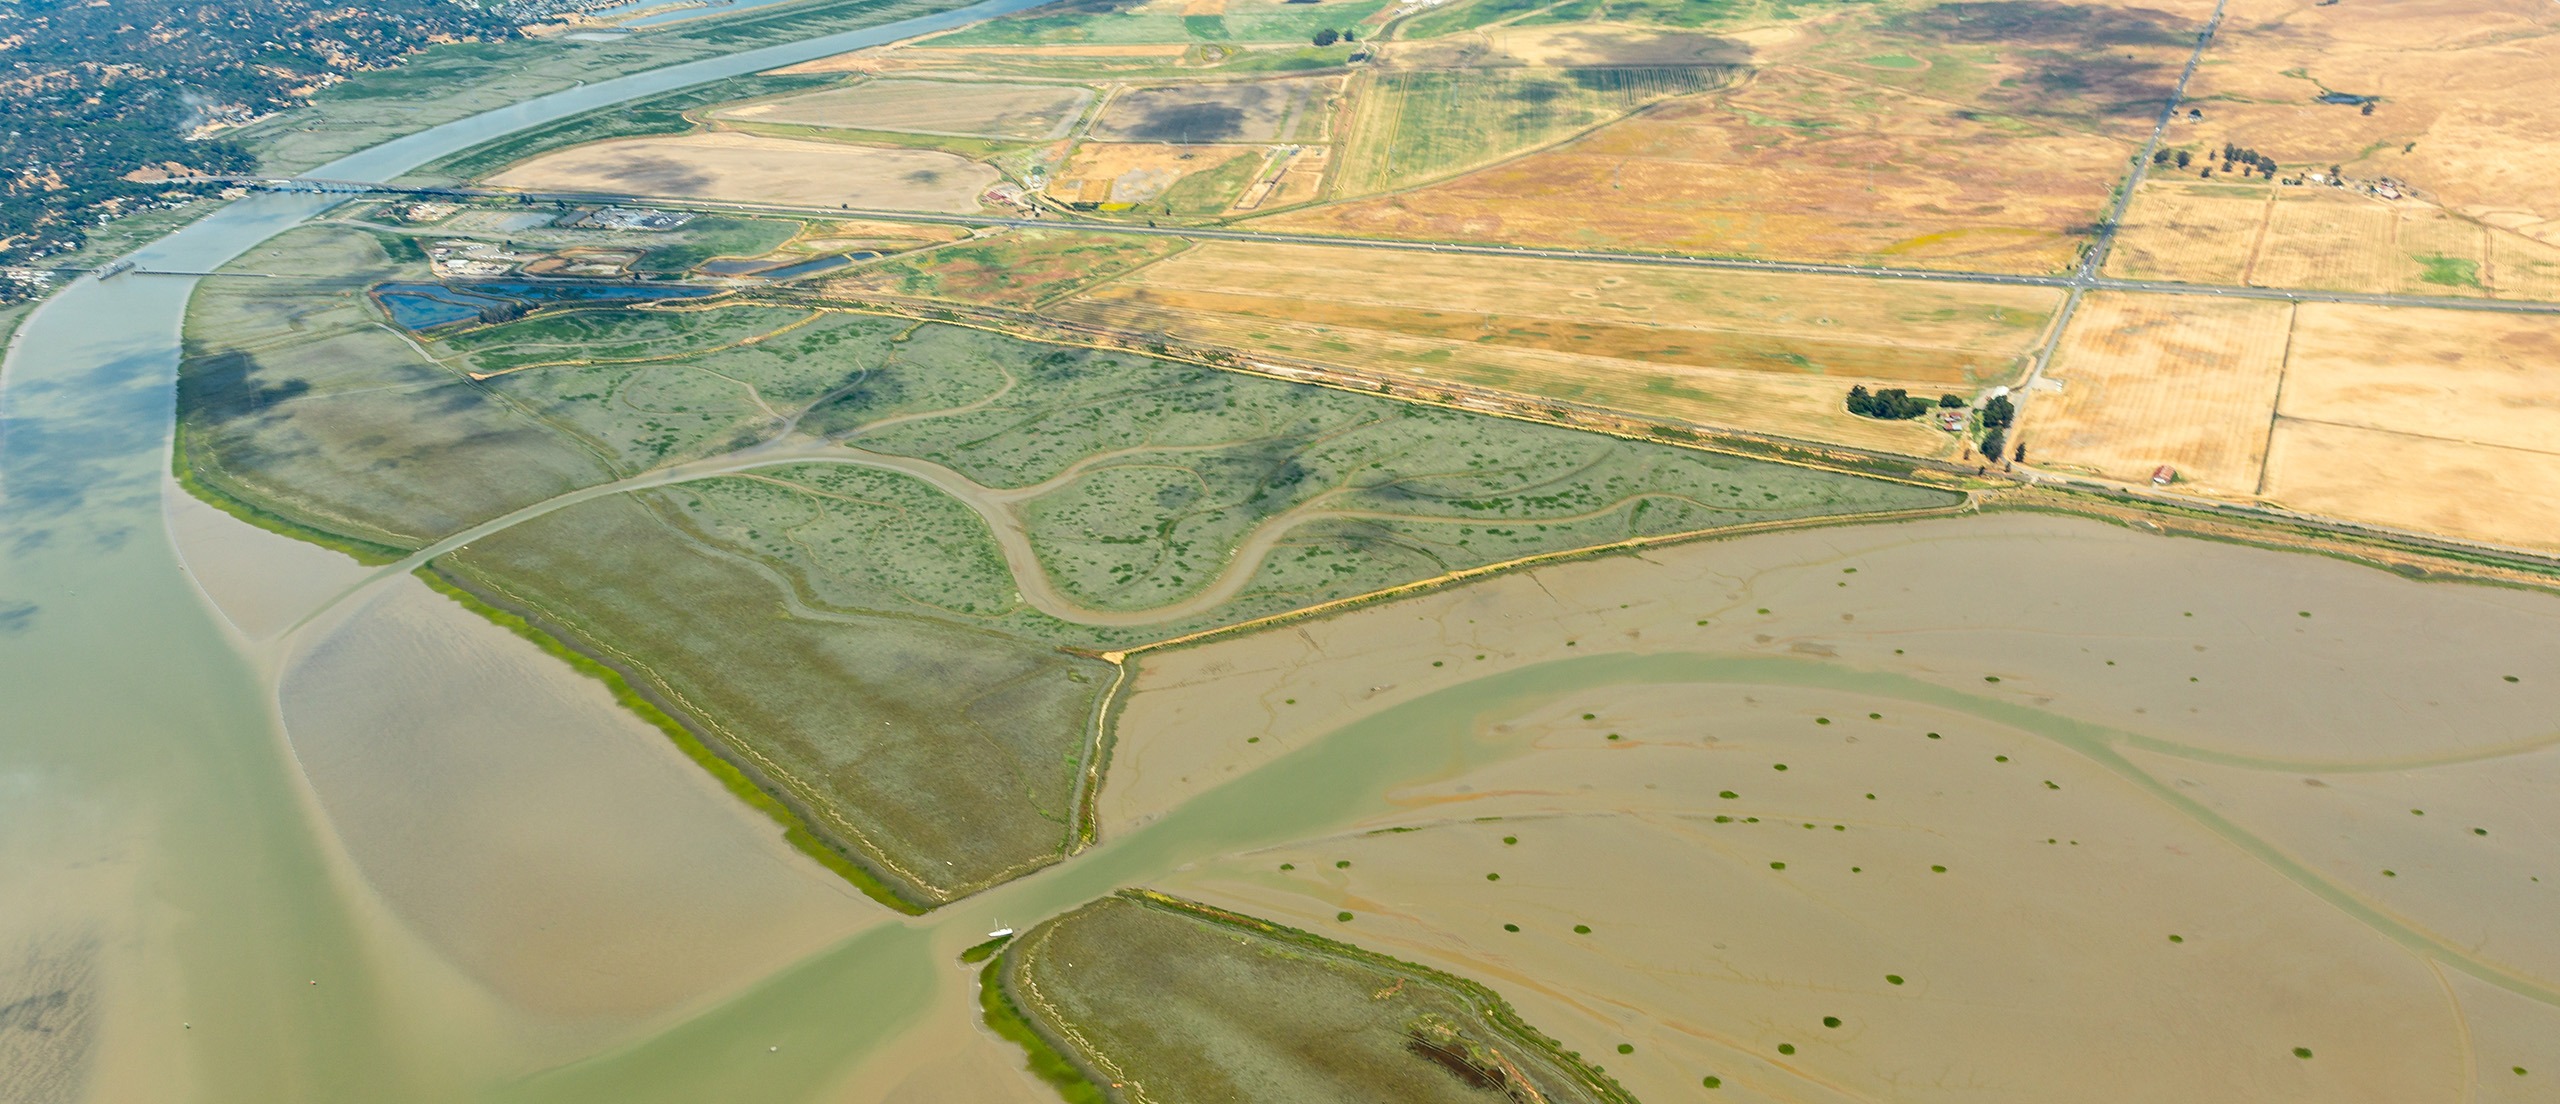
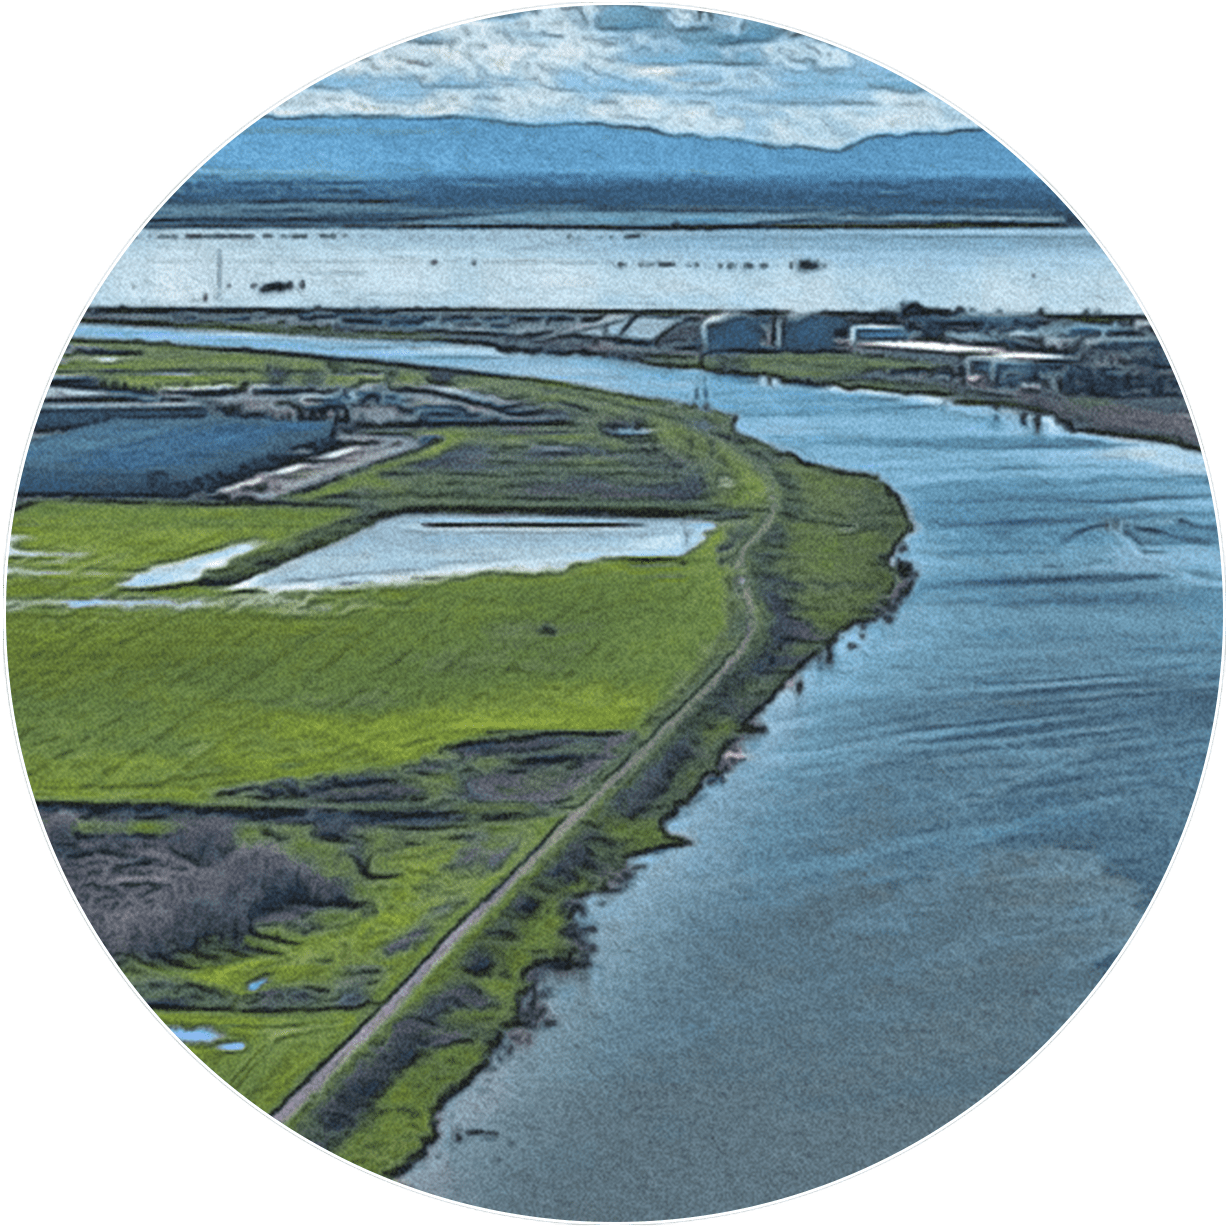
Aerial view of the patchwork patterns of agricultural fields next to marsh restoration where the San Francisco Bay meets the Sacramento-San Jaoquin Delta.
How was this Indicator Calculated?
Data Used
We used land cover & habitat mapping from the Delta Aquatic Resources Inventory (SFEI 2022), Baylands Habitat Map 2020 (SFEI 2024), DWR Statewide Crop Mapping (CDWR 2020), and National Landcover Dataset 2020 (USGS 2021).
Indicator Approach
We used land cover/land use data to assess the distribution of soft shorelines within 200m buffers on either side of the shoreline (400m total width). We first defined the shoreline as the boundary between intertidal and non-tidal areas using a combination of land use, land cover, and habitat mapping. We then summarized land cover/land use into seven categories along a gradient of “softness”, ranging from the “hardest” urbanized areas to the “softest” vegetated intertidal habitats and undeveloped land. We broke up the set-distance buffers into sampling units roughly 250m in width parallel to the shoreline and assigned a rating to each based on the hardness and softness of its dominant land covers/land use category. Based on these ratings for individual sampling units, we derived a Soft Shoreline Index of 0-10, with 10 being the “softest” and 0 being the “hardest” conditions, which we applied to five regions of the Estuary (Delta, Suisun Bay, San Pablo Bay, Central Bay, and South Bay), and to rolled up scores for the Bay and Delta (including Suisuin Bay).
Benchmarks and Scoring
Technical Appendix

Download PDF
Related Indicators
Resilient Processes Category
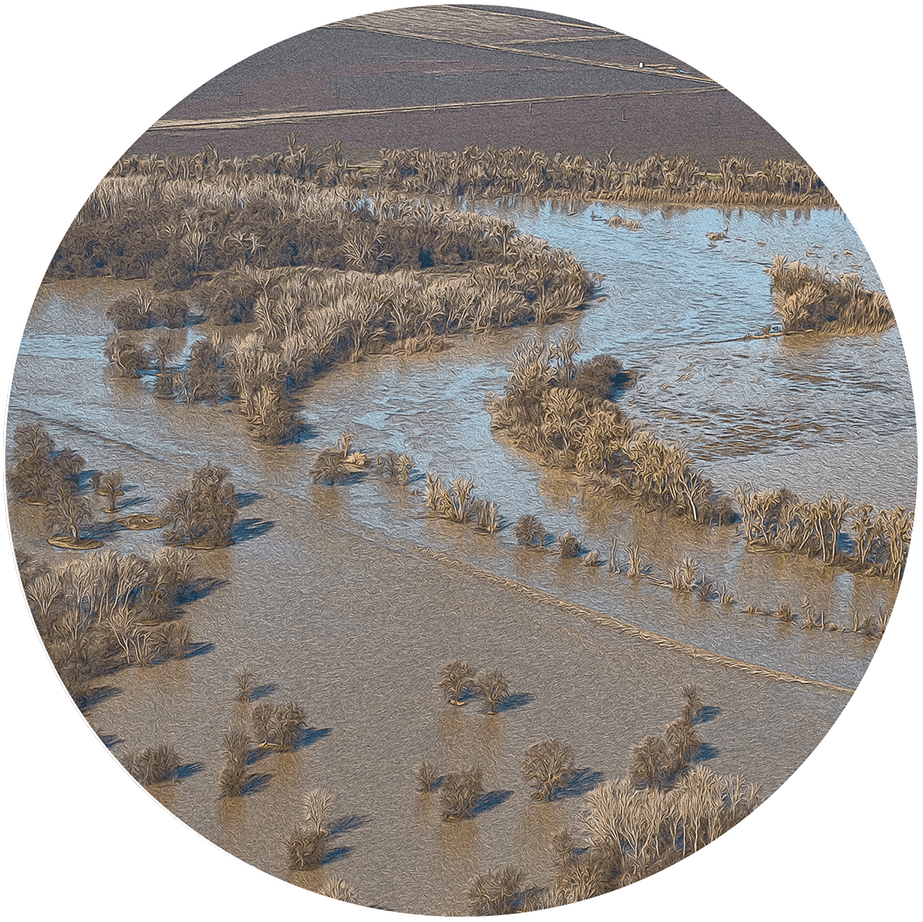
Beneficial Floods
Measures the extent to which freshwater flows create seasonal floodplain habitat upstream of the Delta and low-salinity habitat in the Bay

Migration Space
Measures the amount of protected and undeveloped uplands where tidal habitats can shift inland as sea levels rise (Under development)
Sediment
Tracks sediment supply to existing and restored baylands from natural and engineered sources within San Francisco Bay (Under development)
Subsided Lands
Tracks land area in the Estuary that has sunk below historical elevation levels and land management practices that reverse or halt the subsidence process
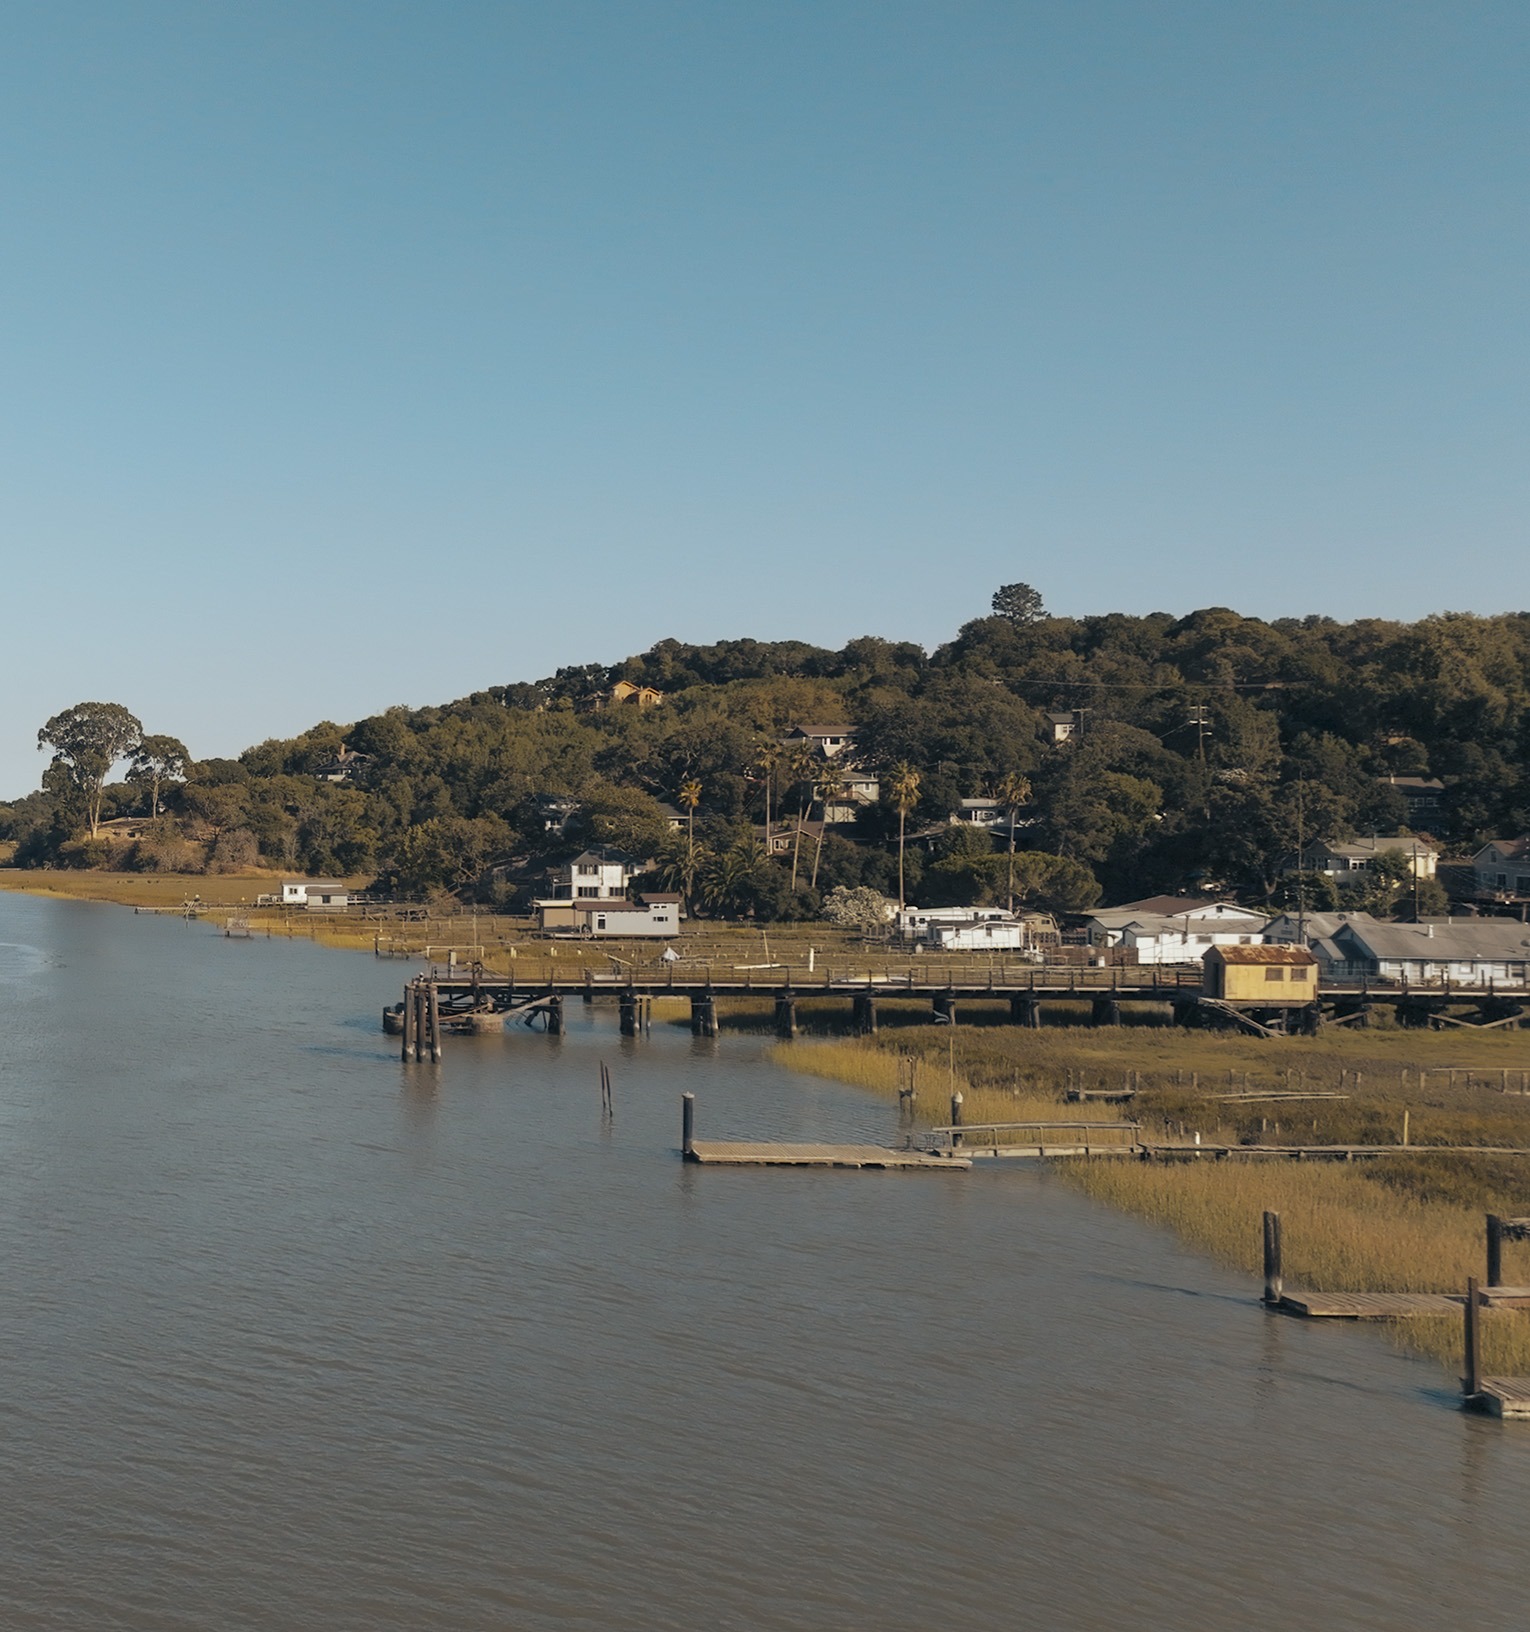
Tidal marsh in Petaluma, CA. Mark Jones, MTC.
Contributing Scientists | Soft Shores
Cate Jaffe, San Francisco Estuary Institute
Katie McKnight, San Francisco Estuary Institute
Citations
- CDWR [California Department of Water Resources]. 2020.
2020 Statewide Crop Mapping GIS Geodatabase. Accessed 10/2023. https://lab.data.ca.gov/dataset/statewide-crop-mapping - Delta Conservancy. 2025.
Nature Based Solutions: Wetland Restoration Funding. Accessed April 11, 2025. https://deltaconservancy.ca.gov/nature-based-solutions-funding/ - Hill, K. 2015.
Coastal infrastructure: A typology for the next century of adaptation to sea-level rise. Frontiers in Ecology and the Environment, 13(9), 468–476. https://doi.org/10.1890/150088 - SFEI [San Francisco Estuary Institute] and SPUR. 2019.
San Francisco Bay Shoreline Adaptation Atlas: Working with Nature to Plan for Sea Level Rise Using Operational Landscape Units. Publication #915, San Francisco Estuary Institute, Richmond, CA. https://www.sfei.org/projects/san-francisco-bay-shoreline-adaptation-atlas - SFEI [San Francisco Estuary Institute]. 2022.
Delta Aquatic Resource Inventory (DARI), Version 1.1 GIS Data. Accessed 10/2024. https://www.sfei.org/data/delta-aquatic-resource-inventory-dari - USGS [U.S. Geological Survey]. 2021.
National Land Cover Database 2021 Products. https://www.sciencebase.gov/catalog/item/6345b637d34e342aee0863aa - WRMP [Wetlands Regional Monitoring Program]. 2024.
“Baylands Habitat Map 2020 v1.1.” Accessed 2024. https://www.sfei.org/data/baylands-habitat-map-2020-gis-data