

Freshwater Flow
Measures the amounts, timing, and variability of fresh water flowing into the Estuary compared to the flows that would have occurred without dams and water diversions

Cosumnes River. Joel Olives. CC BY 2.0. Cropped, colored, textured.
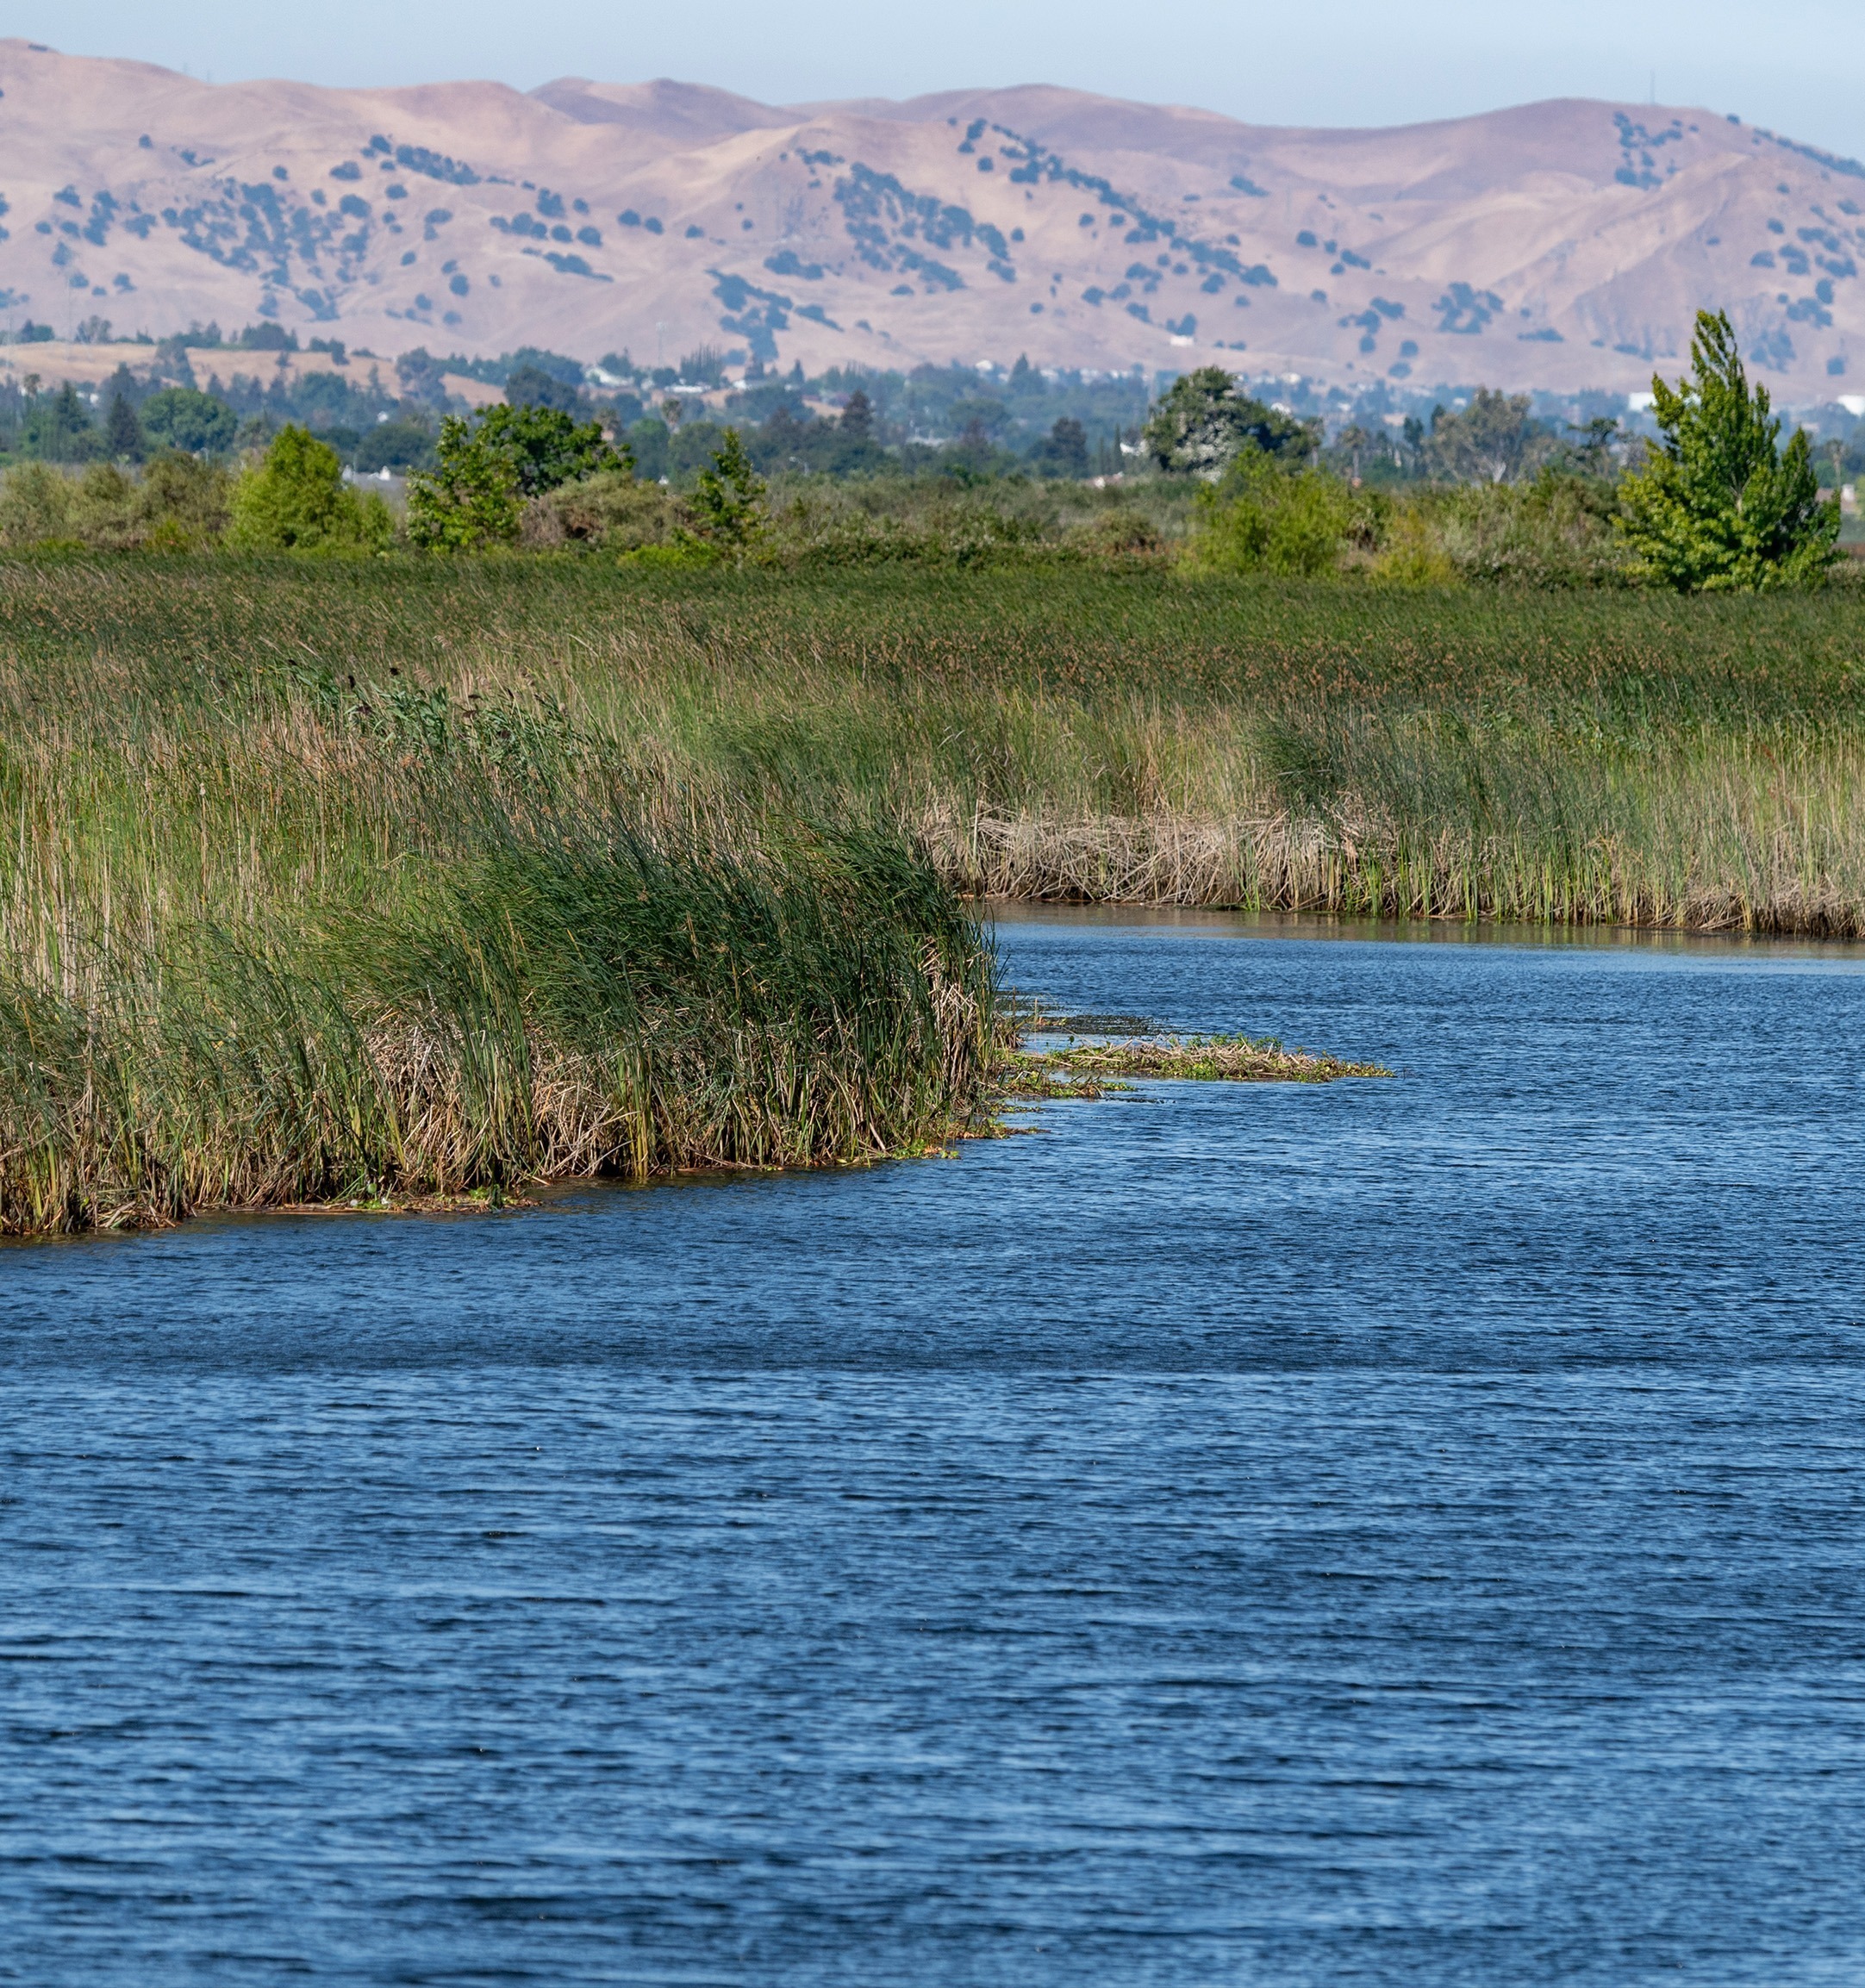
Freshwater Flows Fuel Life in the Estuary
Freshwater Flow
Status & Trend
Latest Update: October 2025

Freshwater Flow conditions in the Estuary remain Poor and Declining. Reductions in freshwater flows have created chronic, artificial drought conditions in the Estuary. Dams and water diversions have nearly halved freshwater flows. High-volume flood flows in winter and spring are less common, leaving juvenile fish and invertebrates without the floodplain habitat and low-saline waters they need to survive (see also Beneficial Floods). The once-dramatic differences in flow levels between the wet and dry seasons, and between wet years and drought years, have been reduced. In the most recent 20 years of data (2004-2023), 14 of 20 years scored in the Poor range, a reversal from the first 20 years of data, when 14 years scored as Good.
Full read
Freshwater Flow in Depth
Over the past 80 years, growing numbers of dams and increased water diversions in the Estuary’s watershed and the Delta have profoundly changed freshwater flow. Water storage in upstream reservoirs and diversions of water to supply agricultural and urban users have cut the amount of fresh water that flows into the Estuary by half. The Estuary’s historical pattern of high inflows during winter and spring, followed by declining flows as summer progressed to fall, has been flattened. Even the year-to-year variation of flows, which reflects California’s unpredictable sequences of wet and dry years, has been reduced. Today, because of these reductions and alterations in inflows, the Estuary experiences flow conditions in most years comparable to those that would have historically occurred only during an extreme drought.
The importance of freshwater flows to the health of the Estuary has been well-documented by decades of scientific research and monitoring. Since the 1990s, state and federal water resource managers have established various regulations for flows and water quality that were intended to improve, or at least stabilize inflows and estuarine habitat quality. Despite these efforts, Freshwater Flow conditions in the Estuary remain Poor and are still Declining. Ongoing and future demand for the Estuary’s water and changes in drought frequency and intensity will keep the pressure on, adding serious new challenges to management efforts to protect and restore the health of this vital Estuary.
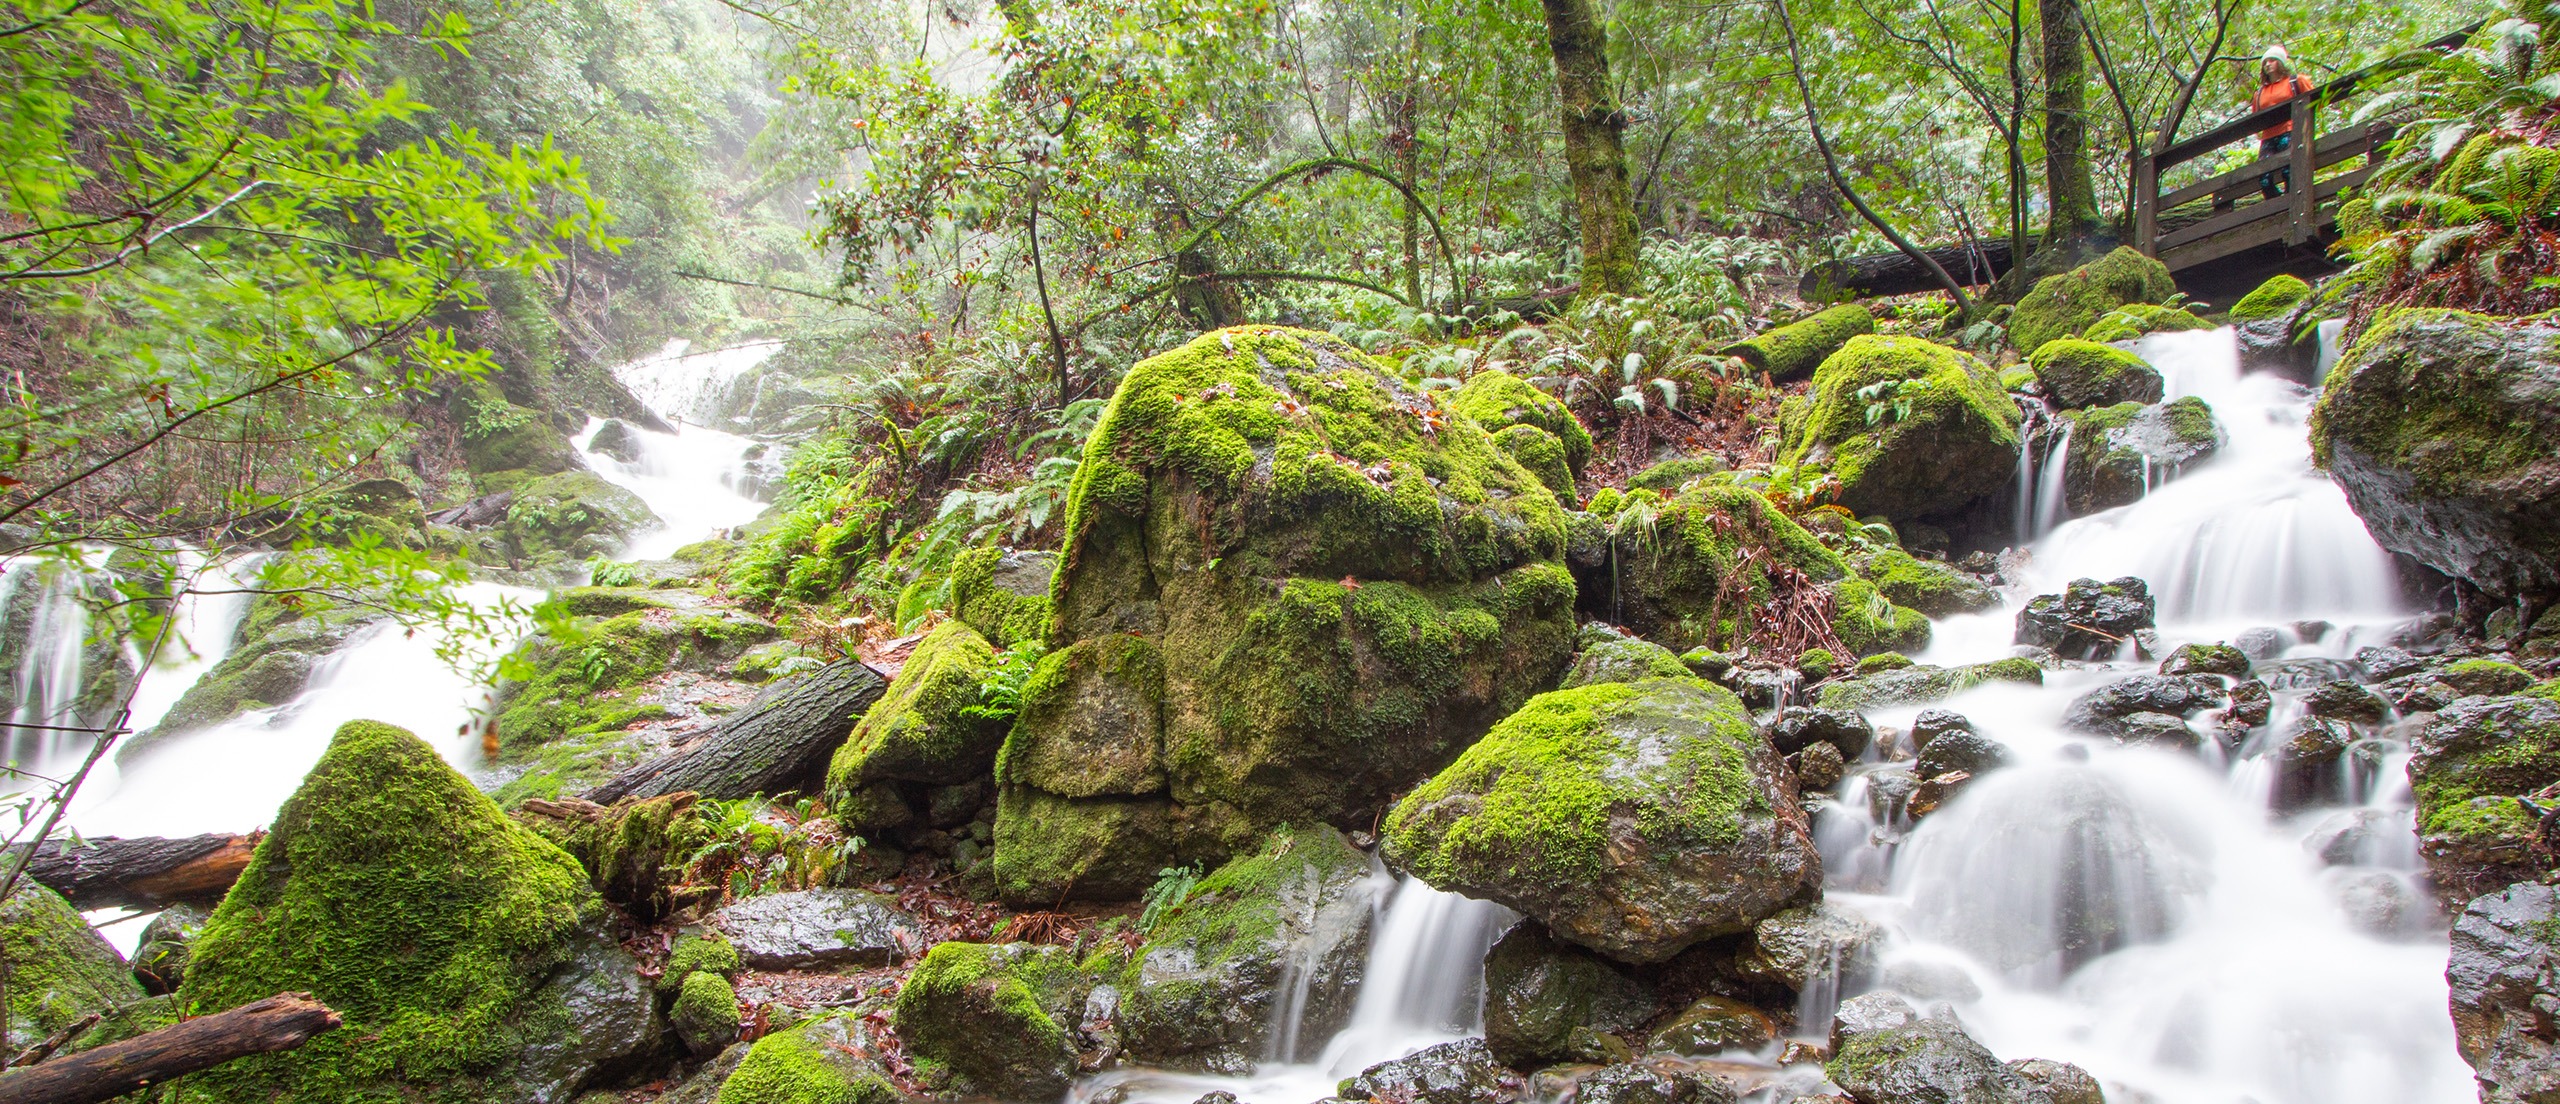
Freshwater flowing from a creek. Ben Botkin, San Francisco Estuary Partnership.

How was this Indicator Calculated?
Data Used
Indicator Approach
The Freshwater Flow assessment uses ten metrics to measure the magnitude, duration, and variability of annual and seasonal flows into the Estuary. Nine of the metrics compare actual flows to the estimated unimpaired flows that would have flowed into the Estuary if there were no dams or water diversions. The tenth metric measures Delta outflow to the Bay as a proportion of Delta inflow. The Freshwater Flow index averages the results from the ten metrics into a single score.
Benchmarks and Scoring
For each metric, baseline values were established based on review and analysis of three sources of information and types of data:
- The scientific literature on the environmental flow requirements for riverine and estuarine ecosystems and on the ecology of the San Francisco Bay Estuary.
- Current regulatory standards and objectives for flow and water quality in the Estuary.
- Historical and/or unimpaired flow conditions to identify and define levels of freshwater flows that promote restoration and enhance ecological function and resiliency.
The metrics were scored on a five-point scale, 0-4 for very poor, poor, fair, good, and excellent. A score of good was assigned if the metric met the baseline condition, corresponding to flow conditions that were altered but adequate to maintain ecological integrity.
For the Freshwater Flow Index status score, the scale was reduced to a three-point scale for Poor, Fair, and Good. The Freshwater Flow Index trend was derived using simple linear regression.
Technical Appendix
Download PDF
Related Indicators
Clean Water Category

Harmful Algal Blooms
Tracks indirect measures of harmful algae concentrations via measurements such as chlorophyll, toxin, and nutrient concentrations (Under development)
Safe for Aquatic Life
Assesses concentrations of toxic pollutants in water and fish from the Bay
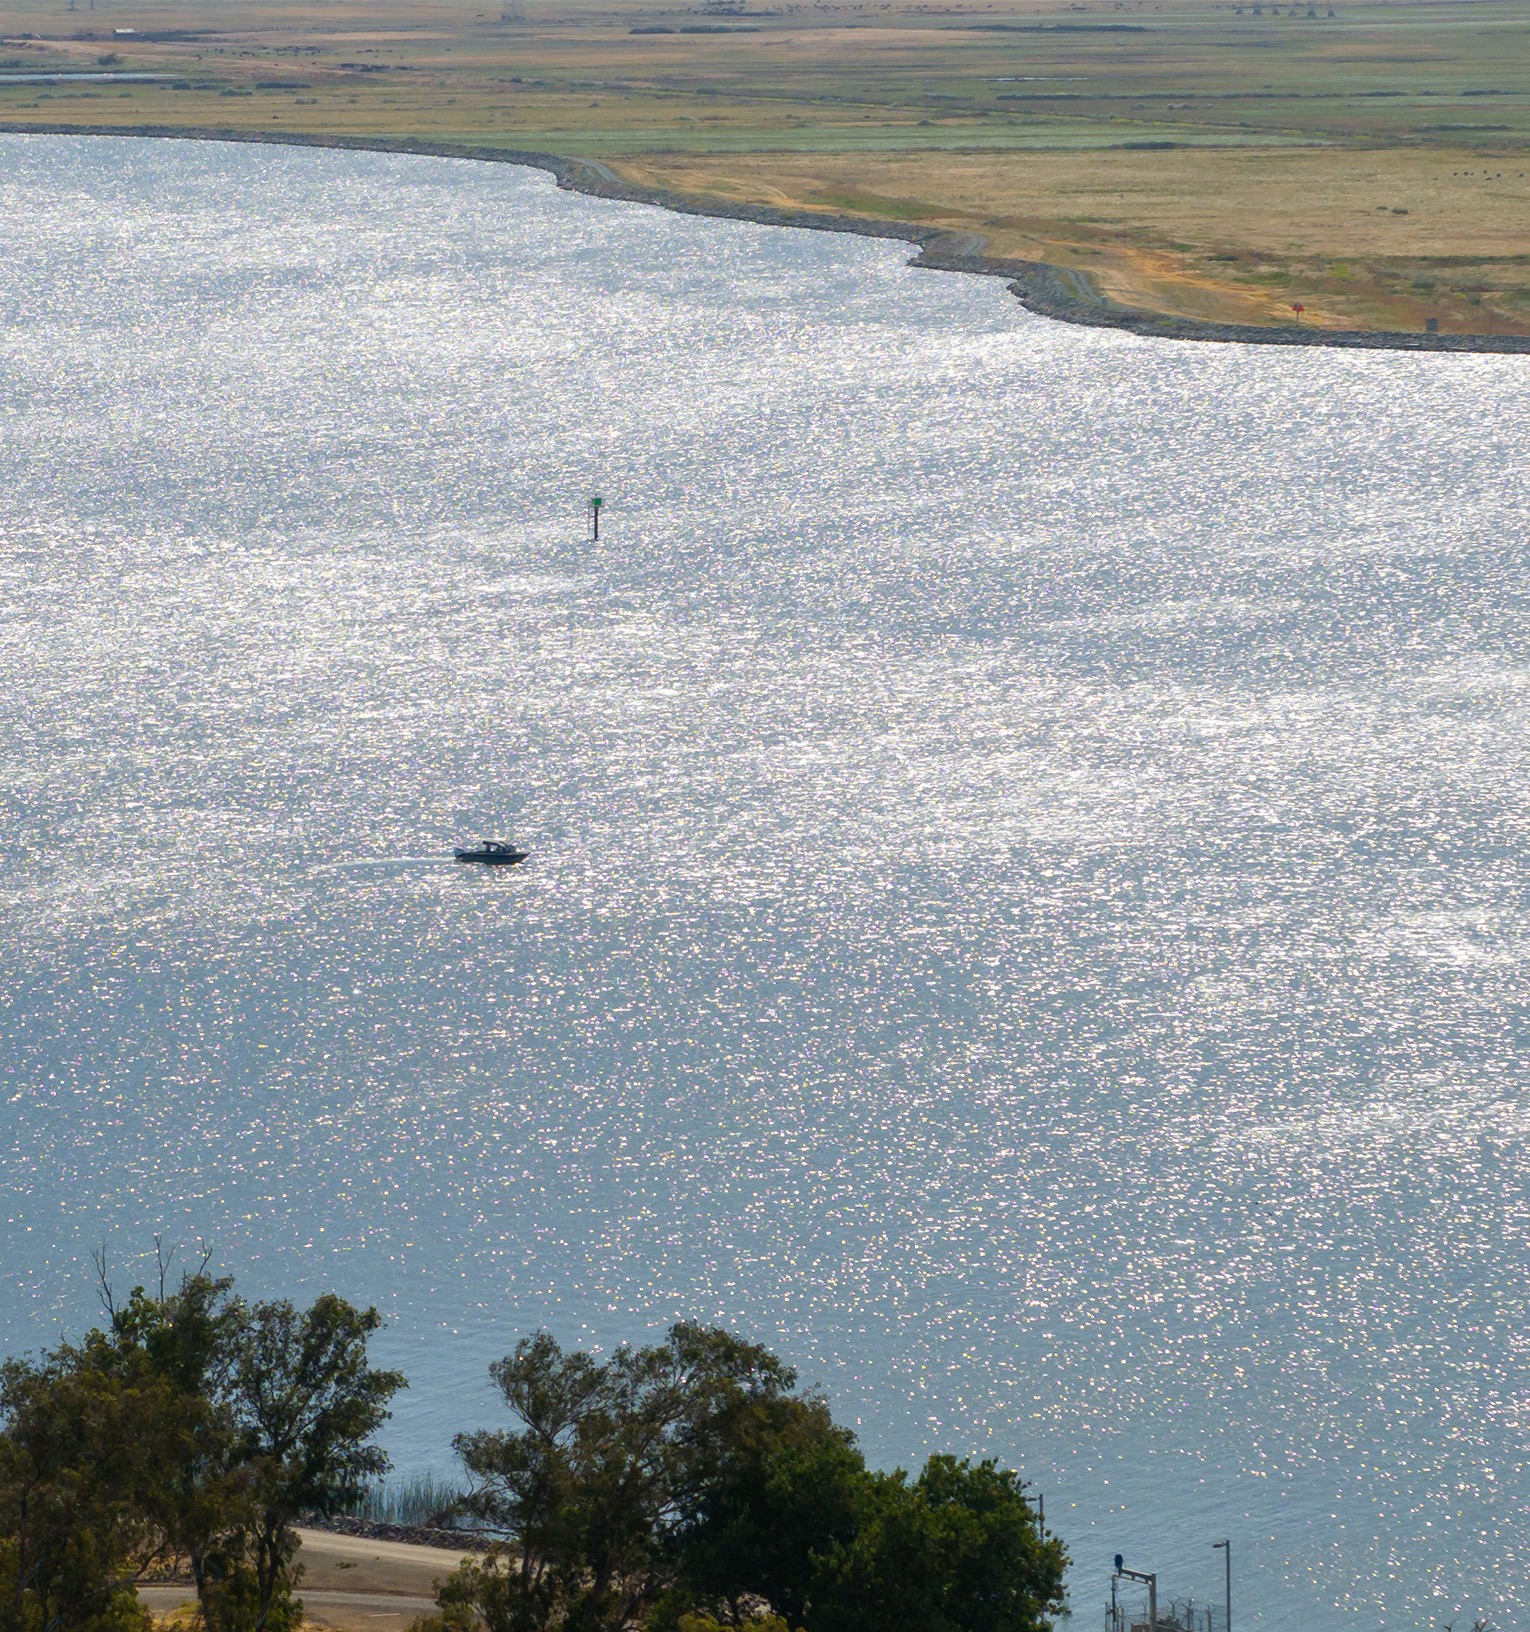
A drone view of the San Joaquin River. Xavier Mascareñas, California Department of Water Resources.
Contributing Scientists | Freshwater Flow
Christina Swanson, PhD
Citations
- CDEC [California Data Exchange Center] and CDWR [California Department of Water Resources]. “Daily Full Natural Flows.” Accessed July 8, 2025. https://cdec.water.ca.gov
- CDWR [California Department of Water Resources]. 2024.
“Dayflow.” Dayflow. https://water.ca.gov/Programs/Integrated-Science-and-Engineering/Compliance-Monitoring-And-Assessment/Dayflow-Data - CDWR [California Department of Water Resources]. “Estimates of Natural and Unimpaired Flows for the Central Valley of California: WY 1922–2014 – California Open Data.” Accessed July 8, 2025. https://data.ca.gov/dataset/estimates-of-natural-and-unimpaired-flows-for-the-central-valley-of-california-wy-1922-2014